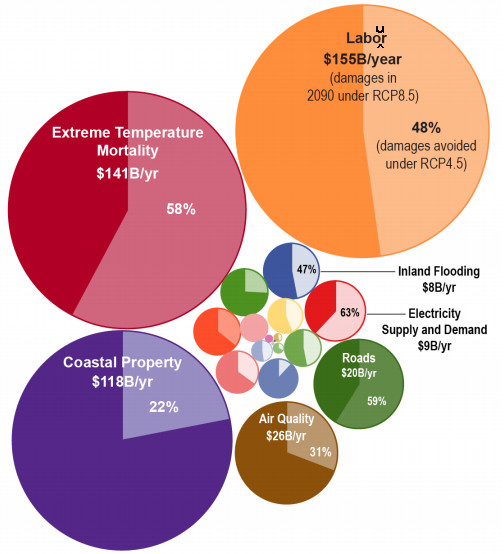
 Or so says Dieter Helm in the FT (arch).Someone called Simon Evans doesn't like it, and although he says it is packed full of wrongness, in an entire Twit thread he lands few if any hits. But I think DH gets some major points right; principally that the entire Kyoto-Paris-etc negotiating theatre is a waste of time and money; and that the response to GW so far, throwing money at subsidies, has been inefficient. What he mostly says is the very limited amount of money that current customers and voters are actually prepared to pay is spent wisely. The money needs to go on those things that might actually make a real difference. I don't think SE likes the "very limited" aspect, but otherwise, the call to spent money wisely should hardly be controversial2; though when phrased as a criticism of the way money is currently being spent it does become so, since it implies that "the" money is currently being spent unwisely. Which I agree with.
But sadly, as soon as DT gets to solutions, he falls into exactly the same trap as the people he is criticising: Instead of putting all the money in the conventional wind and solar panels boxes, some of it should go on research and development. Did you spot the error? The chances are that if you're a researcher you didn't :-). The error is once again trying a top-down directed approach to what should be done. The answer is a carbon tax, and let the market sort things out. Alas people like DT like that idea no more than people like SE like it, because it gives them nothing to pontificate about.
Fortunately there seems to be a genuine chance that solar will spread quickly enough so solve all our problems, despite the general incompetence. And people are currently doing a really bad job on working out the costs of GW1, so this may be for the best. Although effectively saying "don't worry, all will be well" seems a poor plan, given past experience.
Refs
* Carbon budgets and carbon taxes.
* It took me ages to find this so I'll put it here, but its NSFW: Oglaf/Intermission.
* What made solar panels so cheap? Thank government policy?
* As Congress Tackles Climate, Markets Are The Engine But Policies Set The Direction - Forbes
* 7. @BarackObama green stimulus investments pumped $200 billion into renewables, efficiency, and transportation and succeeded politically where cap and trade failed. The huge progress that wind, solar, and EV have made since can in large part be traced back to those investments says Ted Nordhaus.
Notes
1. As ATTP notes in "10% of GDP?"
2. Though now I think about it, I'm actually opposing attempts to spend money "wisely", if "wisely" is read as "after careful consideration by some central authority". But I am arguing for trusting to the "wisdom" or perhaps knowledge of individuals and smaller entities.


:format(webp):no_upscale()/cdn.vox-cdn.com/uploads/chorus_asset/file/13457759/kavlak_solar_pv_cost.png)


