A reader asks, how do emission scenarios affect the IPCC 1.4 - 5.8C temperature range? Can we get a predicted temperature range for a Bush-style "business as usual" emission scenario, another range for moderate action to reduce emissions, and a third for drastic action?.
Short answer: [1.4,5.8] includes model and scenario uncertainty. fig 9.15 shows the T range across models and scenarios; fig spm-5 gives you a key to the various scenarios (or see this SRES fig). Of those, I think A1T and B1 correspond to fairly drastic action; IS92a was the old business-as-usual approximation I think. My pet preference would be HadCM3/IS92a as a base state: that gives you 3 oC at 2100. Switching to A1F1 would put the change above 5 oC; down to B1 puts it down to 2-and-a-bit.
Or if that is too short, read on:
The IPCC says The globally averaged surface temperature is projected to increase by 1.4 to 5.8°C (Figure 5d) over the period 1990 to 2100. These results are for the full range of 35 SRES scenarios, based on a number of climate models (here). There is a footnote to this, which says: Complex physically based climate models are the main tool for projecting future climate change. In order to explore the full range of scenarios, these are complemented by simple climate models calibrated to yield an equivalent response in temperature and sea level to complex climate models. These projections are obtained using a simple climate model whose climate sensitivity and ocean heat uptake are calibrated to each of seven complex climate models. The climate sensitivity used in the simple model ranges from 1.7 to 4.2°C, which is comparable to the commonly accepted range of 1.5 to 4.5°C.
To interpret that: firstly, the *climate sensitivity* (equilibrium climate sensitivity refers to the equilibrium change in global mean surface temperature following a doubling of the atmospheric (equivalent) CO2 concentration (glossary) is about 1.5 to 4.5 oC. But T change to 2100 isn't necessarily equilibrium, so you can knock a bit (0.5-1.0 perhaps) off that range for non-equilibrium effects (except probably B1 and A1T (see here), which are pretty flat by 2100). This effectively leaves higher CO2 scenarios (like A1F1) adding about 2 oC for the effects of higher CO2.
Secondly, a technical point: all these scenarios haven't been run through all the GCMs, it would be too expensive. Most GCMs have (or had, when the TAR was written) only done a few scenarios. So a simple model is tuned to the model performance in one or two scenarios, and then the model is effectively used to interpolate to the other scenarios. For this post, that doesn't matter.
So, fig 5d shows that an "average model" has a spread of [2,4.5] for all the 35 SRES scenarios. Whereas the spread for all models all SRES is bigger, at the aforementioned [1.4,5.8]. You could try taking a single model and computing the spread across scenarios; or you could take a single scenario and compute the spread across models. The TAR sez: By 2100, the range in the surface temperature response across the group of climate models run with a given scenario is comparable to the range obtained from a single model run with the different SRES scenarios.
Then fig 9.15 provides the answer you were actually looking for (or nearly, because it does six illustrative SRES scenarios (don't ask me what they mean by illustrative) across 7 models, but that should be enough for a flavour of what goes on). Unsurprisingly, a higher base state sensitivity (GFDL) scales to a stronger response and hence greater range across scenarios.
Caveats and stuff. #1: I've never been terribly interested in the range for different scenarios. Clearly its a valid thing to ask, but given the large (AFAIK) uncertainties in all the emissions, I'm more interested in "what is the T change at (say) 2*CO2" rather than "what is the T change at 2100". #2: All this is taken from the IPCC TAR. I don't think things have changed much since then. #3 I (and most people) end to talk in terms of CO2 for simplicity; the SRES scenarios include other GHG's, and sulphates, and stuff too.
2005-08-31
Ask Stoat
Shamelessly copying RP's "ask prometheus" feature, I've added an "Ask Stoat" link to the sidebar, which directs here. So, that means I'm inviting you to submit climate-science-type related questions for my careful analysis. I'm not anticipating any great flood, but if there is, you'll have to wait your turn in the queue... Submit your questions via comments on this post, or email. And this may be a good point to mention that I'm tending now to use wmconnolley@gmail.com as my "public face" email, though at the moment it just redirects to the obvious one.
2005-08-30
Barton, belatedly
Curiously the Grauniad has belatedly discovered the evil Barton story. Why now? And it was on R4 at 10 o'clock too. Why now? Is it because they were waiting for some kind of environmental peg (Katrina) to hang it on? If anyone has a better idea, please let me know. The story is more than a month old: it was on RealClimate on July 18th.
McIntyre the Sock
It looks like Steve McIntyre has stooped low enough to using sock puppets. Tim Lambert caught him, and SM seems to have admitted it. Tut tut! And in sci.env too, not only at Tims blog. We also discover who "Per" was, though the answer doesn't appear to be especially interesting.
SM's puppetry was suspected at the time: Nigel rears his ugly head again, I see. Are you a colleague of McKittrick's by any chance, Nigel? The only time you make an appearance here is to defend him... as David Ball put it.
SM's puppetry was suspected at the time: Nigel rears his ugly head again, I see. Are you a colleague of McKittrick's by any chance, Nigel? The only time you make an appearance here is to defend him... as David Ball put it.
2005-08-29
Relax!
The headline was prompted by JF's tribalism: Frankie, anyone? Incidentally, translations of the cryptic references are available on request, if you find them too cryptic.
To understand this (if you really want to) you need to read http://climatesci.atmos.colostate.edu/?p=36#comments by RP; and JF's post ref'd above. Note, BTW, that RP has removed some of the comments from his blog (even James Annan gets rubbed out, along with the wackos), which explains why the comments refer to comments that don't exist and why the numbering is all wrong. Argh!
So: JF complains that I'm being too tribal in being interested in an answer to the question do you think most of the warming observed over the last 50 years is attributable to human activities?. It seems a fair enough question to me. And presumably to RP too, since he answered it "I do". I asked it because I thought his previous answers were ambiguous (and in the end the question turns out to be ambiguous too: see lower down). And other people thought so too, because several people commented on his blog (sadly those comments now seem to have been deleted) that the question I asked was unreasonable; or that RP had said the answer was no (I wish the comments were there so I could quote them rather than rely on memory). Those comments weere of course proved quite wrong, when RP *did* answer the question. And I'm reminded of a wise comment by James Annan, with ref to a post where RP Jr made it quite obvious that he accepts the IPCC consensus, that its very amusing to see the pain ond outrage on the part of the septic ditto-heads when they see such unambiguous statements, because they really thought that RP Jr was on their side. Now that simply isn't possible without some dense and/or ambiguous language (the septics are dumb, yes, but not totally so).
Now for myself, I'm quite happy to accept the IPCC consensus position (slightly updated with post-TAR research, e.g. the most recent MSU stuff) and don't feel any need to have my own position. RP Sr *does* have his own position, and... well, read his blog to find out what it is: thats part of what its for. Starting here perhaps... I got a bit lost in the maze of responses to Andy Revkin. RPs Sr's position is in fact at variance with the IPCC one, because although he agrees on the human influence (see above) he doesn't agree on the cause: which shows that far from questioning too much, I stopped too soon: because Is most of the observed warming over the last 50 years likely to have been due to the increase in greenhouse gas concentrations gets a far more nuanced response from him. Since I agree with the IPCC response, I disagree with RP Sr's nuances, and would simply answer the question with "yes".
A trick from Penrose
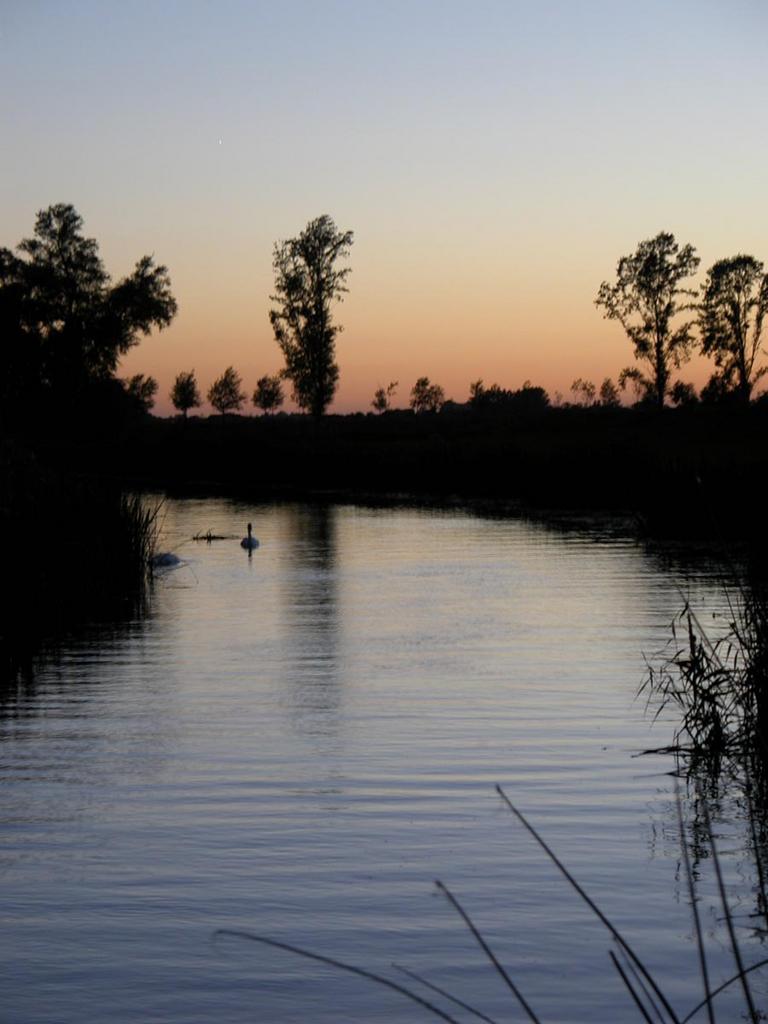 I'm reading Penrose's "The road to reality". I got it for Christmas and after a burst of reading then, haven't got much further. Our just-finished trip up the Old West River (pic: a bit down from the GOBA mooring at sunset yesterday) gave me some computer-free evenings to restart reading it. I discovered I was only 3 pages away from the end of the "maths" sections and the start of the "physics" bits, so finally got to read some of the physics.
Anyway, having struggled about 1/2 way through the text (to ch 22, Quantum algebra, geometry, and spin) my review is: very heavy going; good though; probably rather individualistic in places; maths degree or equivalent a bare minimum requirement. On that latter point: I found it very funny that having lead us through various infinities, Ricci tensors, fibre bundles (still not really sure what those are), gauge connections, etc etc with occaisional nods back to "see the defn on page XX if you've forgotten what index-raising is...) in section 21.1 we have the perfectly normal differential equation y + d^2y/dx^2 = x^5 with (see section 6.3 for the meaning of the symbols). Really! If you don't know what a differential equation is, you're totally stuffed, and ref to 6.3 won't help you. Quite possibly the same is true of the back-refs to Ricci tensors, but I just blip over them...
But, to come to the trick, its in solving the ODE above... taking d^2y/dx^2 + y = x^5, we re-write this as D^2 y + y = x^5, ie (D^2 + 1)y = x^5. Now we treat D as a simple number, and write y = (D^2 + 1)^-1 x^5. This being so, we do a formal series expansion, and get y = (1 - D^2 + D^4 - D^6 + ...) x^5. Since D^6 x^5 is zero (as are all higher powers), we get y = x^5 - 20 x^3 + 120 x. Which is the right answer.
This is a neat trick. I can't remember if I was ever taught it, or even if its commonly known. Did you know it? Then tell me!
Incidentally, M took Beethoven Klaviersonaten Band I to read.
2005-08-25
RSS data now available...
For some time now it has been a bit frustrating that S+C make their global-average data available, but RSS don't. RSS make the gridpoint data available and I roll my own averages, but still its a lot easier (and less error prone) for the originators to do it.
So credit to Roger Coppock for actually *asking* Mears if the averages are available, and... yes they are. See this sci.env thread for the data.
"Ask and Ye shall receive" as the good book says.
Incidentally, a little quibble: Mears says We do not provide data south of 70S for TLT, due to the high altitude of the Antarctic icecap. When the land (or ice) is this high, TLT is no longer measuring the atmosphere!. What do S+C/UAH do?
[Note strenuous avoidance of the words "Spencer" or "Christy" to avoid disputing JA's place at the top of the google order].
2005-08-22
Anyone for a job?
Would you like to be a climate modeller? Then follow http://www.antarctica.ac.uk/Employment/vacancies/job.php?id=381.
New THC paper
There is a new paper intercomparing the response of the THC to increasing GHG forcing up to 4xCO2, more evidence for the view (see posts here) that the THC won't collapse.
Gregory, J.M., K.W. Dixon, R.J. Stouffer, A.J. Weaver, E. Driesschaert, M. Eby, T. Fichefet, H. Hasumi, A. Hu, J.H. Jungclaus, I.V. Kamenkovich, A. Levermann, M. Montoya, S. Murakami, S. Nawrath, A. Oka, A.P. Sokolov and R.B. Thorpe (2005), A Model Intercomparison Of Changes In The Atlantic Thermohaline Circulation In Response To Increasing Atmospheric Co2 Concentration, Geophys . Res . Lett . 32 ( 12 ): Art . No . L12703 Jun 23 2005
As part of the Coupled Model Intercomparison Project, integrations with a common design have been undertaken with eleven different climate models to compare the response of the Atlantic thermohaline circulation ( THC ) to time-dependent climate change caused by increasing atmospheric CO2 concentration. Over 140 years, during which the CO2 concentration quadruples, the circulation strength declines gradually in all models, by between 10 and 50%. No model shows a rapid or complete collapse, despite the fairly rapid increase and high final concentration of CO2. The models having the strongest overturning in the control climate tend to show the largest THC reductions. In all models, the THC weakening is caused more by changes in surface heat flux than by changes in surface water flux. No model shows a cooling anywhere, because the greenhouse warming is dominant.
2005-08-21
What is the point of the CCSP Committee "Temperature Trends in the Lower Atmosphere-Steps for Understanding and Reconciling Differences"?
A reader enquires about my take on "his [RP Sr's] precipitous resignation as chair of one of the CCSP committees in the face of an apparent revolt by the members: http://climatesci.atmos.colostate.edu/?p=30".
Well now, its all very interesting. This is my excuse for yet another MSU post.
First, some pointers to other folk who got there first: Scott Church guesting at Tim "I'm banning you :-)" Lambert's Deltoid (BTW, RC's hit counter is now past 400k, and will overtake TL soon...). James "Slashdotted" Annan dislikes Spencers slurs (I agree). Chris Mooney points to a few other links and curiously praises the Economists article, which I though was poor. But he does point out the curious press release policy on the 3 ScienceExpress stories. Also (can't resist this) it turns out that Spencer is a creationist. Weird or what. Thanks TP.
My take (summary): this committee has been thoroughly overtaken by events and no longer mattters very much. So, scientifically, has the S+C MSU record.
More detail: one (perhaps even the only) of the untidy ends of the IPCC TAR was tropospheric temperature trends, which appeared to be observed to be lower than they should have been (if you believed the GCMs and the sfc records). The skeptics made much of this; most climate scientists were, I think, rather less worried: the record was short, obs have errors, it was a puzzle that would be resolved. See various MSU/S+C posts here.
The puzzle became less puzzling as even the S+C/UAH trends got larger, and other analyses (RSS; Vinnikov and Grody; Fu) got even larger trends, and pointed to probable errors in the S+C trends. Nonetheless there remained an interesting puzzle, and in 2003 a meeting was convened to discuss it - I think ES attended. The meeting didn't really resolve anything, which in retrospect was no surprise. But it did decide to write a report. The prospectus, including lead authors and chapter headings, is at http://www.climatescience.gov/Library/sap/sap1-1/sap1-1prospectus-final.pdf (the "final" is now amusingly wrong, since RP has resigned), all nicely modelled on the IPCC model.
But the problem is that the report has been overtaken by events. Skipping lightly over the history, the three recent papers in ScienceExpress (see Et Tu LT? - and note only 25 comments on this major subject - proof that people don't comment so much on real science :-() show that:
That last point quantifies the "models predict more warming in the trop than at the sfc". This was true, but by no means a major prediction: you have to struggle through the TAR to find any figures showing it. So finally Santer et al have got round to analysing what the models actually do predict.
Point 2 (oh dear I'm going backwards...) is the result of analysing radiation corrections to the radiosonde (balloon) record. Sondes thermometers are subject to solar heating in daytime, and need correcting, and the corrections are to some degree uncertain. The sonde record has never been great. Sherwood et al. suggest that the sonde trend is too low: its early days for this idea yet, but it may well be correct.
Point 1 is the biggie. Mears et al. have worked out that S+C made a mistake in applying a correction to the UAH MSU record. Spencer just about admits this, but in a distinctly weaselly way (in particular "This particular error is within the published margin of error for LT of +/- 0.05 C/decade (Christy et al. 2003)" in http://vortex.nsstc.uah.edu/data/msu/t2lt/readme.07Aug2005 is just blowing smoke): as I understand it, its a simple sign error, but he doesn't admit that. S+C have now made an awfully large number of different corrections to their record, and if they were showing large warming the septic crowd would be howling for their blood for repeatedly adjusting their trends. S+C were the first, but there is no longer any reason for giving their record primacy - far from it: despite all the corrections, their technique is still not beyond reproach. RSS is probably better.
So (if you've read this far) where does this leave the committee? In limbo. If those 3 papers had been available in 2003, no-one would have bothered convene the meeting much less set up a report-writing committee. Had the committee mananged to report in a timely way, it might have been worth something, but not a lot, because the main point was the errors in S+C's dataset and possibly in the radiosondes. So perhaps its just as well its late. They will probably feel obliged to publish something, but maybe they should just not bother.
And where does this leave RP Sr's resignation? I don't have a lot of sympathy for his POV, which appears to be The current discussion in the media based on the three Science Express articles misses the more significant issue of spatial trends in tropospheric temperature trends. This is just wrong, at least in terms of impact: the overwhelming issue, which caused the committee to be set up, was the difference in global average trends. It may not have been RP's interest, which may be why he is so miffed, but it was everyone elses.
Well now, its all very interesting. This is my excuse for yet another MSU post.
First, some pointers to other folk who got there first: Scott Church guesting at Tim "I'm banning you :-)" Lambert's Deltoid (BTW, RC's hit counter is now past 400k, and will overtake TL soon...). James "Slashdotted" Annan dislikes Spencers slurs (I agree). Chris Mooney points to a few other links and curiously praises the Economists article, which I though was poor. But he does point out the curious press release policy on the 3 ScienceExpress stories. Also (can't resist this) it turns out that Spencer is a creationist. Weird or what. Thanks TP.
My take (summary): this committee has been thoroughly overtaken by events and no longer mattters very much. So, scientifically, has the S+C MSU record.
More detail: one (perhaps even the only) of the untidy ends of the IPCC TAR was tropospheric temperature trends, which appeared to be observed to be lower than they should have been (if you believed the GCMs and the sfc records). The skeptics made much of this; most climate scientists were, I think, rather less worried: the record was short, obs have errors, it was a puzzle that would be resolved. See various MSU/S+C posts here.
The puzzle became less puzzling as even the S+C/UAH trends got larger, and other analyses (RSS; Vinnikov and Grody; Fu) got even larger trends, and pointed to probable errors in the S+C trends. Nonetheless there remained an interesting puzzle, and in 2003 a meeting was convened to discuss it - I think ES attended. The meeting didn't really resolve anything, which in retrospect was no surprise. But it did decide to write a report. The prospectus, including lead authors and chapter headings, is at http://www.climatescience.gov/Library/sap/sap1-1/sap1-1prospectus-final.pdf (the "final" is now amusingly wrong, since RP has resigned), all nicely modelled on the IPCC model.
But the problem is that the report has been overtaken by events. Skipping lightly over the history, the three recent papers in ScienceExpress (see Et Tu LT? - and note only 25 comments on this major subject - proof that people don't comment so much on real science :-() show that:
- The S+C trends were wrong, by a large margin, because they made a sign error
- The radiosonde trends may well be too low too
- Models predict about 1.3 times as much warming in the trop as at the sfc
That last point quantifies the "models predict more warming in the trop than at the sfc". This was true, but by no means a major prediction: you have to struggle through the TAR to find any figures showing it. So finally Santer et al have got round to analysing what the models actually do predict.
Point 2 (oh dear I'm going backwards...) is the result of analysing radiation corrections to the radiosonde (balloon) record. Sondes thermometers are subject to solar heating in daytime, and need correcting, and the corrections are to some degree uncertain. The sonde record has never been great. Sherwood et al. suggest that the sonde trend is too low: its early days for this idea yet, but it may well be correct.
Point 1 is the biggie. Mears et al. have worked out that S+C made a mistake in applying a correction to the UAH MSU record. Spencer just about admits this, but in a distinctly weaselly way (in particular "This particular error is within the published margin of error for LT of +/- 0.05 C/decade (Christy et al. 2003)" in http://vortex.nsstc.uah.edu/data/msu/t2lt/readme.07Aug2005 is just blowing smoke): as I understand it, its a simple sign error, but he doesn't admit that. S+C have now made an awfully large number of different corrections to their record, and if they were showing large warming the septic crowd would be howling for their blood for repeatedly adjusting their trends. S+C were the first, but there is no longer any reason for giving their record primacy - far from it: despite all the corrections, their technique is still not beyond reproach. RSS is probably better.
So (if you've read this far) where does this leave the committee? In limbo. If those 3 papers had been available in 2003, no-one would have bothered convene the meeting much less set up a report-writing committee. Had the committee mananged to report in a timely way, it might have been worth something, but not a lot, because the main point was the errors in S+C's dataset and possibly in the radiosondes. So perhaps its just as well its late. They will probably feel obliged to publish something, but maybe they should just not bother.
And where does this leave RP Sr's resignation? I don't have a lot of sympathy for his POV, which appears to be The current discussion in the media based on the three Science Express articles misses the more significant issue of spatial trends in tropospheric temperature trends. This is just wrong, at least in terms of impact: the overwhelming issue, which caused the committee to be set up, was the difference in global average trends. It may not have been RP's interest, which may be why he is so miffed, but it was everyone elses.
2005-08-20
Hello world I'm back from Holiday
 I'm back from hols, processed my mail backlog (1,273 messages, a new record, mostly because I forgot to unsubscribe to wiki-en before going off...), and realised I have a few things to catch up on (JAs bet in the Grauniad and Nature; the MSU papers finally coming out).
Speaking of MSU, it was interesting how little effect this earth-shattering news had on the real world: not a mention of it in the papers I was reading. Ho hum.
I did manage to get some climbing in though. Ynys Lochtyn has a seaward face, mostly a bit broken, but with some stuff steep enough to be worthwhile, though only about 20m high. The white-patched overlapped slab slightly L of centre is now called "Seal" (cos I saw one basking on a nearby rock when I finished). It goes up the slab (with some holds in the darkness on the R edge of the slab), then slightly L on the overhangs (a bit out of balance for a few moves) then up R on more broken ground. Possibly HS.
The corner in the R end of the pic goes straight up and is "Crab" (because looking down from the top I could see some down in the water. Futher off to the R out of shot is a slightly easier corner, "Dolphin", because I saw a few whilst belaying; Cardigan bay is good for dolphins), and might be S or a bit easier.
We also tried Cym Cywarch but the paths are very overgrown and we didn't find even the foot of the climb we were looking for. The valley is very beautiful though.
2005-08-02
Pielke Senior has a blog
RP senior has a blog. Its quite interesting, and its about climate. Its http://ccc.atmos.colostate.edu/blog/ if you want to look.
In my normal carping way I'm going to pick up various points with which I diagree. So don't treat this as a review of the blog overall (and in fact it would be rather presumptuous of me to "review" his blog overall, given his status (err, and mine...)).
Browsing, Pielke and Christy Comment on Hansen et al. Science paper entitled “Earth’s Energy Imbalance: Confirmation and Implications.” caught my eye. In it, they complain that Science won't publish their comment. Well, tough, I say: Science doesn't publish a lot of things. And when you get reviews back like:
then you're not going to get published. Thats ferocious stuff (there's another review, which is also highly critical, though more measured).
I find this interesting because it has shades of other controversies:Christy Spencer [oops, wrong one: thanks to TPa: here] whining that he wasn't asked to review Fu; and another one that I can't remember now. That particular post looks like a severe error of judgement to me.
Coming back to the MSU (I do seem to be getting a bit obsessed by it... sorry) elsewhere, RP complains about people saying that the surface and upper-air records of temperature change can now, in fact, be reconciled which rather suggests that he should be asking Christy about the vn5.2 dataset... Yet again elsewhere he notes that Recently, Christy et al. (2003) demonstrated a strong correspondence between their version of the MSU time series and several other independent measures of tropospheric temperature trends, and they conclude that the Mears et al. (2003) trend is likely too strong.. Which might have been fair enough when he wrote it, but blogging about it now, when even S+C admit that their trend is now the same as Mears, is a bit odd. It also points out that there will be a lot of rowing back to be done when S+C finally publish. There's also the interesting point (and I've said this on sci.env but not here): given that S+C *do* assert a good correspondence between vn5.1 and sondes, what are they going to do about the 50% larger trends in vn5.2? If it *still* matches the sondes, then the sondes are a poor test. If it doesn't... are they going to say their data is wrong? Or are they suddenly going to discover that the sondes aren't so good after all? Interesting...
BTW, speaking of Christy, the rumour is: August 11th. Just checking to see if you read through to the end...
In my normal carping way I'm going to pick up various points with which I diagree. So don't treat this as a review of the blog overall (and in fact it would be rather presumptuous of me to "review" his blog overall, given his status (err, and mine...)).
Browsing, Pielke and Christy Comment on Hansen et al. Science paper entitled “Earth’s Energy Imbalance: Confirmation and Implications.” caught my eye. In it, they complain that Science won't publish their comment. Well, tough, I say: Science doesn't publish a lot of things. And when you get reviews back like:
The exchange is not worthy of publication. In fact, I do not understand why P&C even wrote their piece in the first place. They continually destroy whatever point they had in mind by noting Hansen ‘did it right’... None of the participants in this pathetic exchange seem to have the slightest clue about the large decadal noise that exists in the oceans and some ocean models.
then you're not going to get published. Thats ferocious stuff (there's another review, which is also highly critical, though more measured).
I find this interesting because it has shades of other controversies:
Coming back to the MSU (I do seem to be getting a bit obsessed by it... sorry) elsewhere, RP complains about people saying that the surface and upper-air records of temperature change can now, in fact, be reconciled which rather suggests that he should be asking Christy about the vn5.2 dataset... Yet again elsewhere he notes that Recently, Christy et al. (2003) demonstrated a strong correspondence between their version of the MSU time series and several other independent measures of tropospheric temperature trends, and they conclude that the Mears et al. (2003) trend is likely too strong.. Which might have been fair enough when he wrote it, but blogging about it now, when even S+C admit that their trend is now the same as Mears, is a bit odd. It also points out that there will be a lot of rowing back to be done when S+C finally publish. There's also the interesting point (and I've said this on sci.env but not here): given that S+C *do* assert a good correspondence between vn5.1 and sondes, what are they going to do about the 50% larger trends in vn5.2? If it *still* matches the sondes, then the sondes are a poor test. If it doesn't... are they going to say their data is wrong? Or are they suddenly going to discover that the sondes aren't so good after all? Interesting...
BTW, speaking of Christy, the rumour is: August 11th. Just checking to see if you read through to the end...
Those were the days... / View
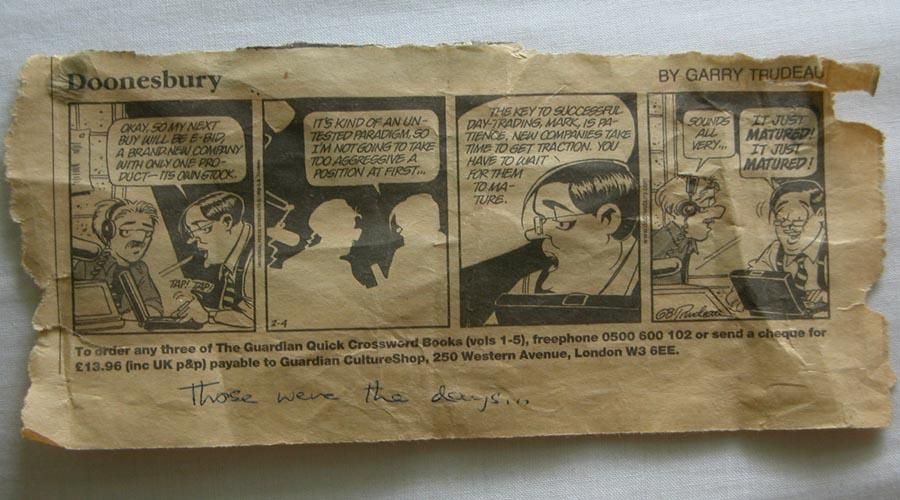 It is the end of an era. Miriam's career with ATML/Virata/GlobespanVirata/Conexant is now over. But (and I) you need shed no tears for her: she gets to doss around all summer playing the piano before working with a new startup in the Autumn and beginning the process all over again.
There is no science in this post, of course.
The cartoon sums it all up: those heady dot-com days when we were all going to become rich with stock options (we didn't go in for any of the day trading stuff). Miriam kept it pinned above her desk as a reminder.
The company started as a Herman Hauser startup in about 1993. M joined in 1995 I think; in those days it was ATML. It was going to get rich in the 'ATM to the desktop ' revolution with ATM switches and network cards to replace Ethernet ones... Miriam started off in "diskbricks" which was some kind of raid-y thing for video serving. The ATM revolution never got off the ground, but fortunately DSL came along, and the company, renamed 'Virata' by then (after some long-forgotten piece of company product... it was the only suitable anme they owned the namespace for), was perfectly poised for it. DSL is based on ATM technology, and Virata made sale after sale after sale (Miriam helped with that bit...).
Then came the glorious days of the internet boom and the IPO when vast paper fortunes were made, and they moved to glorious custom-built offices in the science park (rather inconvenient that, it increased Miriams cycle ride from 20 mins to 35) with a glorious boardroom table in the shape of a curvy V and a round table for the dot on the logo. I shall draw a discrete veil over the crash times. All this was under the management of Charles Cotton, who seemed to be good. But! Then came the disastrous (and in retrospect, rather hard to explain) decision to "merge" with Globespan to form Globespan Virata, when CC left, and times got leaner, in a sense (in a sense, because there was still a huge cushion of IPO money; but the stock options became... uninteresting). And then a bit later the seal was set with the takeover by Conexant.
During all this process the company grew, and left the original Cambridge site far behind. Around IPO time (before?) it got a US presence that came to dominate the company, probably a loss, the culture starting shifting. All the mergers and aquisitions left the company with overlapping bits that no-one was brave or strong enough to kill. Various foreign things got bought (an Israeli company with a name designed to make it seem non-Israeli...) and then other bits got disposed of in the last 2-ish years of the "downsizing" phase when the management-speakers got the upper hand. The upper levels started saying things like "Our revenue is X. So our accountants say we should be employing Y people. So Z people are to become redundant" apparently without realising that if you lose (useful) people the productivity and income go down, so you then go through another round of "Our revenue is now X*0.8. So..." and round again. So in the end it turned into waiting your turn to get downsized... Miriam made it to the end, but it was depressing and she is happy to be out.
An amusing feature of the successive names was the game of spot-the-old logo in various places: the sign outside the building changed; but the V boardtable was never replaced and various layers of old names existed.
But even in death (at the farewell barbeque) the aura of money hadn't quite faded: comparing it to an equivalent type event at BAS (well, OK, we're not closing: but it was just the annual barbeque really) the amount of free stuff floating around was just... well.
If any of this sounds like mourning for the death of a dream, it isn't. Their products are basic stuff buried in modems (our most exciting moment came when a friend phoned up to say "we've just got a new modem and when it boots up it says Virata on it!" with chip names like Helium, Hydrogen, Claudius... but those may be the internal names anyway. It was probably useful stuff, but anything of any value still exists elsewhere. What was distressing though was how an enthusiastic creative bunch of people got managed into a pile of junk. So it goes.
 And the obituary... here is the logo from the farewell tee-shirt :-)
Miriam says (I find this a bit surprising from the outside, but maybe I got to hear more of the bad stuff) that Virata is considered a Cambridge success story, with positive effects on their re-employment.
At one point this post was going to compare the inefficiency of Communism (no-one does anything) with Capitalism (everyone works to cross purposes and there is gross wasteful duplication, like 100 ants carrying a leaf pulling in all directions). But I can't be bothered to do that properly...
 Meanwhile... back in the real world: do you think I should cut back our grape vine? This is the "view" from our bedroom window.
Polar amplification and MSU, combined.
A little while ago I write about the mechanisms of polar amplification of warming: which appear to be mostly ice-albedo feedback and the dynamical habit of the tropics of exporting information. The old favourite - inc GHG can have more effect when its cold - didn't seem to figure.
But now, idly googling for "Spencer and Christy" I came across S+C's report for 1978-2003. It will probably all have to be revised when the vn5.2 data finally becomes "official", but therein they offer this:
I rather suspect this is wurble, with no analysis behind it: its an explanation in search of an effect. But its its interesting to see someone who (presumably) knows something about atmospheric radiation putting it forward. By contrast, Keith Shine (who very definitely does know about radiation) didn't recognise the idea (pers. comm.).
Another interesting feature of that report is that the second major headline of it is "The atmosphere is warming" in big letters. Oddly enough, the std.spetics don't seem to have picked up on that... in fact, I sometimes wonder if S+C have noticed, either...
But now, idly googling for "Spencer and Christy" I came across S+C's report for 1978-2003. It will probably all have to be revised when the vn5.2 data finally becomes "official", but therein they offer this:
That cold air has very little water vapor in it, so if you add another greenhouse gas you have an opportunity to trap more heat. When you go to the tropics, where there’s lots of water vapor, the extra carbon dioxide doesn’t have as much effect. As a greenhouse gas, carbon dioxide’s greatest effect is in the driest, coldest places
I rather suspect this is wurble, with no analysis behind it: its an explanation in search of an effect. But its its interesting to see someone who (presumably) knows something about atmospheric radiation putting it forward. By contrast, Keith Shine (who very definitely does know about radiation) didn't recognise the idea (pers. comm.).
Another interesting feature of that report is that the second major headline of it is "The atmosphere is warming" in big letters. Oddly enough, the std.spetics don't seem to have picked up on that... in fact, I sometimes wonder if S+C have noticed, either...
Subscribe to:
Posts (Atom)