2005-09-28

Arctic sea ice trends

A week or so I posted about Global warming 'past the point of no return' ?!? which commented on a rather over-excitable piece in the UK newspaper the Independent. I was a bit skeptical of the newspaper; now RP sr has a post too, and he quotes Mark Serreze saying:

In conclusion, Mr. Connor [the Indie journo] has “jumped the gun.” I am firmly convinced that at least part of what we are seeing in the Arctic is due to human influences. However, sensationalist articles like Mr. Connor’s only serve to further polarize what is already a very polarized issue... I feel “ambushed” by Mr. Connor’s article.


So... whats up? Firstly, RP Sr seems to like the UI seaice data, I don't know why. As SB points out in a comment here they were wrong a while ago when they disagreed with NSIDC. To introduce yet another source, I'm going to use the NCEP product for this post (because its easily available; probably the answer to my RP question above is that the UI product is easily available for his purposes), though (as I pointed out here) I actually prefer the Bootstrap to the NASA Team product, at least for the Antarctic. also (for fans of important-but-boring detail) I'm going to use total area for my trends, not extent. Its all different ways of processing the same [[SSMI/SSMR]] dataset, anyway.

NSIDC has a press release out Sea Ice Decline Intensifies Summer Arctic sea ice falls far below average for fourth year, winter ice sees sharp decline, spring melt starts earlier which has some nice pics in it and some useful discussion by scientists (I'm doubtful about "The persistence of near-record low extents leads the group to conclude that Arctic sea ice is likely on an accelerating, long-term decline" early in the piece, I suspect that was put in by the PR folks. Its not really supported by the graph just next to it, which shows 2005 as low, but not really far below the trend line. Having said that, if their fig 2 is correct, the ice does seem to be unusually late recovering this year). Why they felt the need to put it out today, rather than waiting a few more days until the end of september, I don't know. Anyway, sea ice doesn't change that much over a few days so their pic is probably going to be correct at the end of the month. RP says that NSIDC haven't made sept available: but the NCEP GRIB is available in realtime from ftp://polar.ncep.noaa.gov/pub/cdas/ for anyone with the patience to convert it (you want wgrib, if you want to convert it, which you don't want to do...).

So *my* contribution to this is the piccy here, which shows sea ice area trends (% per decade) from the NSIDC (thank you Bob) dataset from 1979-2004 (black) and -2005 (blue) up to august. Because in all this the fact that the trends are quite seasonal is being missed a bit. Note that my trend for september is about 10%; NSIDC say about 7-8% depending exactly on which year you stop. The difference is probably due to me using area rather than extent (a quick test says that switching to extent reduces my trend by about a factor of 1.4).

Oh... and the usual caveats apply. I've checked my pic a bit but I did this all in an hour at home tonight, so if anything looks madly wrong to you, you may well be right.

[Update: and the *other* thing I was going to say which I forgot was... this is all pretty well in line with the model results, as far as I can remember them. I'm thinking of Recent and future changes in Arctic sea ice simulated by the HadCM3 AOGCM by Gregory, J. M.; Stott, P. A.; Cresswell, D. J.; Rayner, N. A.; Gordon, C.; Sexton, D. M. H. So the attribution of the trend to GW seems reasonable.]

Why are we having a hearing that features a fiction writer as our key witness?

The headline for this post is the rather plaintive quote from minority leader senator Jeffords' statement at the US Senate EPW committee hearings today. The fiction author is the egregious Crichton.

This question is a reasonable one. The answer is obvious: that Inhofe has totally lost the plot. The details however remain to be seen.

There doesn't seem to be much else available yet, but I'll update this when there is.

Note that this is the Inhofe hearings, not the Barton hearings, which seem to have been wimped out of for the moment.

[Update: there is now an RC post on this with some more detail. Wonkette and Think Progress also take the piss. Note that we need to be careful: Crichton deserves dishonour and (slightly contradictarily) contempt (I like Hobbes and his definitions). The point at issue is not C's worthless opinions, but the apparent waywardness of a (presumably) powerful US senate committee.]

Welcome to RC readers...

A welcome to any RealClimate readers who have follwed the new link across... my humble personal blog having been deemed link-worthy at last!

Perhaps this is a good time to re-state the blogs purpose. Mostly, its for climate science type things, though generally at a lower level of detail and quality than RC aims for. However this may lead to a slightly faster response time and I also comment on things "beneath" (or too personal) for RC. And then of course theres the odd bit of politics or misc.

Don't forget to check out my blogroll on the banner...

Some highlights from the past


I'm in the process of constructing a whole "guide to stoat" (as a precursor to doing the same for RC), but in the meantime a few bits and bobs that I shall call highlights, mostly in reverse time order:


  1. Junkscience is junk - no surprises there
  2. A primer on GW sources also check the comments
  3. Soil carbon losses
  4. Not betting on Climate - anyone prepared to put their money where their mouth is? (Rumour that Gray has just said he will... could be interesting)
  5. More myths of the near future
  6. Ask Stoat - any questions...?


Meanwhile, radio4 news had a prominent item (including piece from Todd Arbetter, just appointed at BAS!) about the low sea ice this summer. Hmmm, must check up: is this reality or the over-efficient NASA PR machine? [The bbc r4 link is: http://news.bbc.co.uk/1/hi/sci/tech/4290340.stm]

Killer Sudoku

There is a new and interesting sudoku variant, the so-called "killer", in which you get no starting clues at all but you get to know the sums of certain boxes. Like this:


So far, its only available in the Times. If you want a hint on how to start, then: the sum of each 3x3 must be 45 (1+2+...9). So the middle-left box has a 36 and a 17 (sum = 53) with one box hanging out of the 3x3. Hence that one box must be an 8 (53-45). I'll leave you the rest, the guide time was 28 mins but I think thats a bit optimistic unless you're very good.

2005-09-27

Misc stuff

One of those tedious posts listing things the author has been reading recently. This is in part because I was going to write some politics stuff and discovered other people have said it all anyway... BTW, I find I had 22 tabs open to write all this, is that a record? Whats your maximum?

News just now is that Quark Soup has gone, somewhat earlier than promised. Space for a brief muse there perhaps... it was the first blog I read; perhaps DA somewhat lost his place when other climate-type blogs (RC mainly; perhaps even Stoat) took some of his niche. Deltoid was the next one I read... I trust they won't be going out in order.

So... capitalistimperialistpig (who I owe a response on energy balance... its coming... in the meantime, this) condems the US Policy of Torture. We don't do torture ourselves (at least not in public) but why do we need the Law Lords to decide should evidence extracted by torture abroad be admissible in the British courts? rather than the more obvious just-say-no. I'm wondering if terrorism is the new paedophilia is the new witchcraft... Mikael Hallendal finds a story about someone getting arrested in the London subway [ahem... underground] for no good reason, but you've read that through Planet Fleck already. Guantanamo is weird too but that piece is a slightly different slant.

Just like everyone else I read "Don't get stuck on stupid" though I seem to have taken a different moral from it than everyone else.

Meanwhile, over at Creek Running North, I discover the concept of Lurker Day (via, I think, John Quiggin). So, lurkers here, treat this as an invitation to say hello...

Dead trees: I'm reading A War against Truth - An Intimate Account of the Invasion of Iraq by Paul William Roberts. I was lent it. So far I'm up to p73 and I have to say that while its interesting, its a little bit too much yes-yes-I-agree-with-that sort of stuff. And... its a bit too passionate, so I'm not sure all of it can quite be trusted.

For wacko science, I followed [[Zbigniew Jaworowski]] to http://www.21stcenturysciencetech.com/Articles%202004/Winter2003-4/global_warming.pdf. He is, ostensibly, predicting cooling... so he should be up for a bet, yes? Ho ho. Speaking of wiki, Jimmy Wales has a blog but it doesn't get updated much.

Wacko maths is also available (no, not string theory (ho ho)) via the talk page of [[Cantor's diagonal argument]]. In some ways this is comforting: I spend a lot of time arguing with wacko GW septics, but at least in that case there is no definite mathematical proof. In the Cantor case, there really *is* definite proof, but the wackos still can't cope with it. Side note: check out the article itself, which points out (did you know this? I didn't) that "the diagonal argument was not Cantor's first proof of the uncountability of the real numbers, but was published three years after his first proof."

No space for this today, so I'll put a placeholder for we-are-rich-but-full-of-sh*t, by which I mean it seems that the amount of total twaddle (and I mean meaningless bureacracy, not GW wackos) generated by a society is related to its wealth. The richer you are the more parasites you can afford. Which, looking forward, is bad news.

Via CIP, I found "ecosystems" and discovered I am a Slithering Reptile (CIP is only a Flippery Fish :-).

2005-09-26

Junkscience is... junk

Well, you all knew that anyway I suppose, but what I didn't realise until just taking a look recently was quite how appallingly bad it is. At http://www.junkscience.com/MSU_Temps/Model_Request.htm they ask "if anyone has managed to recreate say, Earth's global mean temperature track for the period 1880-2000 (we'd accept 1880-1979 or some reasonable facsimile) as GCM output". Errrm, well, yes, you can try reading the TAR. Figure 12.7c: http://www.grida.no/climate/ipcc_tar/wg1/450.htm#fig127 has a nice picture (it even goes back to 1860), for example, and refers you to the appropriate papers. Note that the JS quote fails to say exactly what measure they mean, but later down they say "annual mean temperature track" so presumably they do mean annual mean. But if so, why do they then say "any track that manages to stay within ±1.5 °C..." when, as the TAR pic makes clear, thats far too generous an error margin.

So, I admit, I'm baffled. Have the septics really lied to themselves so often that they have come to believe it? I suppose so.

[Update: if you're mad enough to look at http://www.junkscience.com/MSU_Temps/Warming_Glance.htm you'll find the UAH data plotted, with the excuse that they don't plot RSS because "RSS do not publish Lower Troposphere MSU data". But this is false. The data is available from Rss's ftp site and you'll find it ref'd at a page rather more respectable than JunkSci: [[Image:Satellite_Temperatures.png]]. I've mailed them this, we'll see if they upgrade.]

2005-09-24

John Houghton caught blogging?

Well, commenting anyway. While browsing opendemocracy's climate change discussions, I came across this which appears to contain a reply by JH. Which I found rather interesting. Of course there is no way to know if it really is JH, but the answer is much like that he would give, so maybe.

Apart from that, OD rather proves JA's point about fragmentation: sci.env is a better way to go.

Meanwhile another John (Lawton, ex-head of NERC) said If this makes the climate loonies in the States realise we've got a problem... but then he was always quite blunt.

Also, an interesting one on Mars cl ch which calls.. ahem... certain people idiots. You Know Who You Are. Hold on a mo... astro? Its our old friend from sci.env SS though he hasn't posted there since 2001.

2005-09-23

Back to the ice ages: Ice, by Fred Hoyle

[Beware: long intro...] A long while ago, in the mid-70's, there was a minor kerfuffle about the "coming ice age". A good summary of the episode comes from the words of noted Alarmist Richard Lindzen (warning: I'm being ironical) the scientific community never took the issue to heart, governments ignored it, and with rising global temperatures in the late 1970s the issue more or less died as written in the journal of the notoriously pinko Cato Institute. The only lasting influence of the episode was in the powerful, but self-contradictory, lyrics of the Clash's Londons Burning: "The ice age is coming, the sun is zooming in". See http://www.wmconnolley.org.uk/sci/iceage/ for a badly organised but very detailed look at various sources; or [[Global cooling]] for a better-organised but briefer version; or RC:94 for a general blog-type survey (all those are essentailly mine).

There were various contributing factors for the kerfuffle: a slight observed cooling trend (which was bigger in the northern hemisphere than globally; and in the mid-1970's the first such datasets were being put together; I think the initial ones exaggerated the cooling compared to more modern records); probably, an end-of-worldish feeling (Cold War etc etc); and a growing recognition that there had been far more ice ages in the past than previously realised, and that projecting such cycles forward "predicted" another ice age... sometime; and a realisation that human outputs of aerosols could lead to cooling. In the public mind, the distinctions between these got very blurred, and the Clash song is probably the best (though I suspect unintentional) reflection of this.

However, by the late 1970's/early 1980's research had advanced. The early uncertainty (would CO2 leading to T up, or aerosols leading to T down, predominate?) was being resolved in favour of CO2 and T up; and the observational record was getting to be of higher quality and was showing the end of the cooling trend.

Which is why pretty well everyone agrees that whatever scare there was, it was over by the 1980's. So where does that leave... [at last, end of intro]...

ICE: A chilling scientific forecast of a new Ice Age

by

Sir Fred Hoyle FRS (published 1981).

And the answer is: well behind the times (aside: putting your qualifications on the front cover is a bad sign. And asserting that you are giving a "scientific forecast" is a pretty broad hint that it will be quite the reverse). In fact (and I'm going to continue in a deconstructionist vein for a while: eventually I'll get on to talking about his science, such as it it) the tone is set by the start of the intro: "Forty-five years ago, almost two-thirds of a lifetime ago, I was a research student in the University of Cambridge...". And in those days, the theories of the ice ages were discussed (with, by modern standards, an almost total absence of data). And "The Croll-Milankovich theory was ... largely discounted in my student days... my own opinion has not shifted". And in a nutshell, thats it: while the rest of the world has largely accepted (certainly by 1981) orbital forcing as the cause of the ice ages, Hoyle was clinging to his student days.

One possible reason for why is that (from the point of view of dramatic climate developments) adopting the orbital forcing view is rather dull, since you don't get to predict exciting immenent ice ages. Orbital frequencies are slow, the relevant ones are 20, 40 and 100 kyr cycles, and predicting a new ice age in 5kyr isn't going to sell many paperbacks. You need a theory that will predict faster changes.

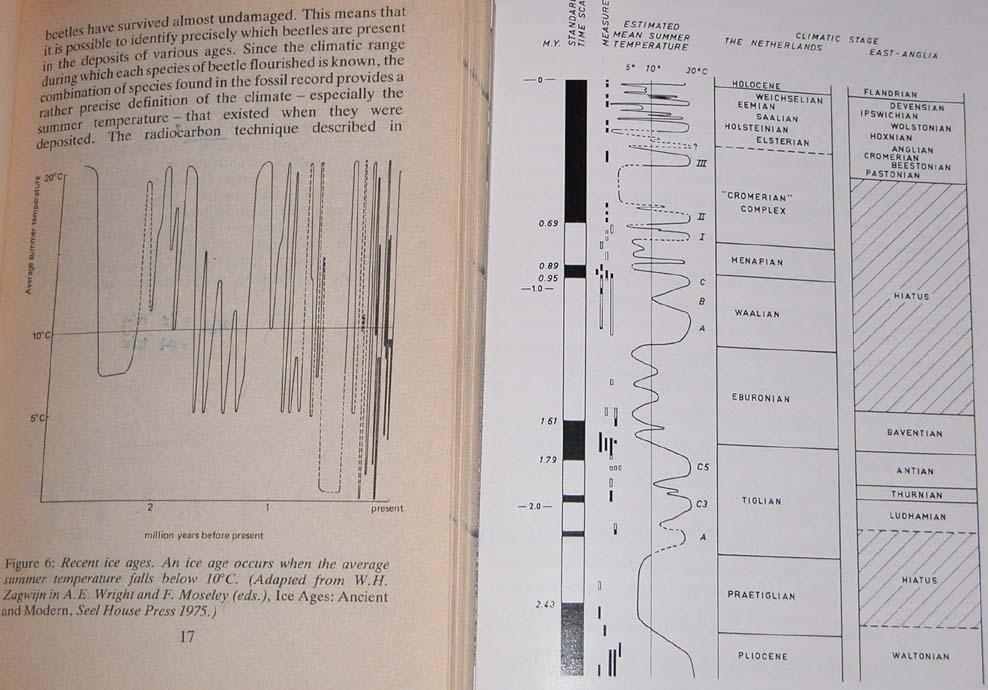
But before looking at Hoyles theory, what about his evidence? Early on, he asserts that ice ages are getting more frequent. As evidence, he produces this pic, which is redrawn from "Ice Ages: Ancient and Modern" eds. Wright and Moseley. In fact most of his evidence is from this volume, which is perfectly respectable of its sort, but its dated (its a conference proceedings of a UK inter-university conference from 1974) and its of-a-certain-type, to my reading. Its glacial tills, beetles, pollen records, all the kind of stuff you do from tramping around formerly glaciated regions. Of the (then new and exciting) field of ocean sediment cores I can find nothing. In 1974 it was perhaps a bit fuddy-duddy, but not fatally so. By 1981, when Hoyle was writing, it was very badly out of date. Which brings me to the figure. As you can see, Hoyle says his is re-drawn from theirs, and it is. Though... it has been stretched a bit, and the not-entirely-coincidental result of this is that his oscillations look much more abrupt, which suits him. Hoyle says that the figure shows that the oscillations have been growing more extreme and more rapid. This is (briefly) supported by the text in the original article. But: we now know its wrong. [[Temperature record]] (the 450 kyr and 5.5 Myr pics) will show you that the ice age cycle *hasn't* been getting more frequent. In fact it swapped from a 40 kyr cycle to a 100 kyr cycle about 1 Myr ago.

My best-guess of why Hoyles figure is wrong is the obvious: the sort of records that figure is built from have higher resolution the more recent they are. So of course they show up more oscillations in the recent periods, just because they can resolve them. Fortunately, ocean sediment cores don't suffer from that problem. Unfortunately for Hoyle, he knows that, because he reproduces as his fig 43 a 700 kyr sediment-derived ice proxy from Shakleton and Opdyke, which flatly contradicts his fig 6, and which he should have known is more homogenous and more reliable.

And its worse than that, because the seminal Hays, J.D., J. Imbrie, N.J. Shackleton. "Variations in the Earth's orbit: Pacemaker of the Ice Ages." (Science, 194 (1976): 1121-1132) had been published in 1976, and convinced just about everyone of the Milankovitch theory of the ice ages (the orbital-forcing theory is an interesting one, probably the most-wrong-ever theory in the history of science, people kept on and on proposing new connections which were continually disproved every time new evidence came along, until they finally got the theory right), leaving behind only people like Hoyle. And its even worse than that, because he even discussed HIS briefly (p 66). He gets it terribly wrong. HIS show by fourier analysis that the periodicites in the sediment cores are what you expect from orbital forcing, with a dominant 100 kyr peak. Hoyle caricatures this as (I paraphrase) "if there was an ice sheet (for other reasons) of course the orbital periods would be picked up by a sufficiently sensitive statistical technique". Hoyle is trying to imply that these are small fluctuations, hard to see. They aren't. They are the dominant signal in the frequency domain. Either Hoyle has misunderstood the fourier analysis (unlikely: he is a pretty eminent physicist, which implies good maths) or he is evading the point of the HIS paper and misleading us (and thats being kind).

OK... so, if you've got this far, then I hope that I've convinced you that Hoyle is wrong, or at least pinning his hopes on dodgy out-of-date evidence. But what is *his* theory? Lets read on...

Firstly, Hoyle convinces himself that erratics can't have been transported by glacial flow (why? it comes in later); then that the only way for ice ages to occur is for changes in the earths albedo (reflectivity) to occur. Which brings us to chapter 8, where things get wacky.

Hoyles theory is going to be that ice ages occur when a layer of ice crystals forms in the upper atmosphere when the temperature drops far enough (below -40 oC) that crystals spontaneously form in the absence of cloud condensation nuclei (CCN). Which is where things get odd, because temperatures below -40 oC are fairly common in the upper atmosphere (OK so its quite dry there, but still, thats not his point). He qualifies his -40 as occurring at the "top" of the water vapour distribution, and by "top" he means the point in the atmosphere where it becomes radiatively thin enough that IR starts escaping to space. What that has to do with absolute temperatures and WV condensing, though, is anyones guess. By another wild leap, he then decides that if global precipitation is less than 56 cm, diamond dust will form in the upper atmosphere, reflecting incoming solar and cooling the planet. Then there is a heat-storage bit, and finally he arrives at his theory: that an incoming meteorite will throw up enough dust to cool the earth temporarily, and 10 years of that is enough to kick in his implausible mechanisms and cause an ice age. Whew.

So: his theory has a 10-y precusor period of vast storms, lightning strikes (which split off the erratics) and nice smooth ice sheets build up down which the erratics merrily slide, friction free (he really does say this: well, at least, he says "skating rink"), wheeeee. They even go uphill this way, if pushed by a bit of wind.

Well, thats about it. Naturally Hoyle has to avoid discussing his original (incorrect) observation that the ice ages were becoming more frequent, because his theory doesn't predict that. Nor does it appear to predict that regular 100 kyr cycle he knew was actually observed (but he could probably have wangled a 100 kyr periodicity in meteorites had he tried hard enough). A disappointment at the end is that his theory doesn't even predict an immenent ice age - all it predicts is an unknown chance of one at some point. Hey ho.
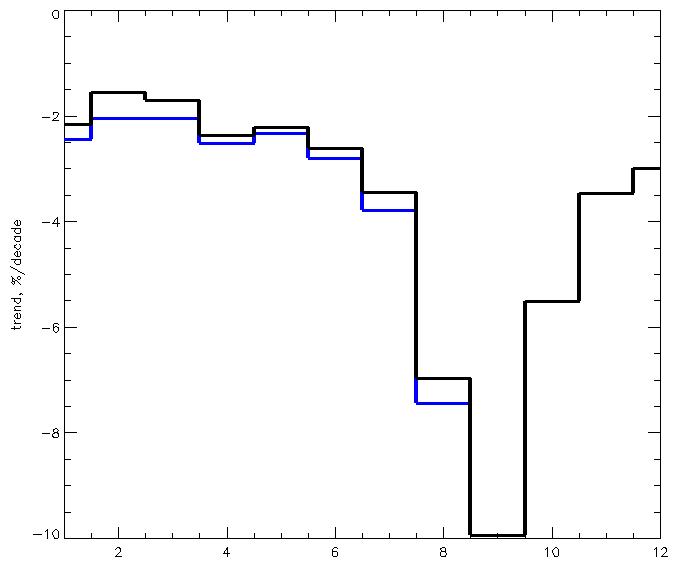
2005-09-22

Rita Skeeter

Sorry, still got HP on my mind. Anyway, I found this from wikipedia rather interesting: not the text of this page (interesting enough, true) but the disclaimer:

2005-09-21

Technorati

Although somewhat unsure of what exactly it is, I have joined Technorati, driven insane with jealousy (and incredulity) by LM's top listing there under "climate": http://technorati.com/blogs/climate. Although it looks to me that there is no assessment of quality in their ranking.

So this is an experiment, this post is supposed to be tagged as: .

[Update: RC now includes "climate" (it was just "climate science") in its tags, and now stomps Lubos into second place. I'm in fourth... come on folks, link to me and put me into second!]

2005-09-20

A primer on sources for global warming

Its time for a handy guide to info on climate change and global warming.

If you only have time to read one page, then the Wikipedia page Global Warming is a good place to start (but see the wiki-caveat at the end of this post) and to follow the links.

If you have lots of time and are prepared to read technical language and want lots of pointers to the literature, then the IPCC 2001 report (TAR) is unquestionably the place to go. Or you can read just the Summary for Policymakers or the in-between Technical Summary. The TAR has ageed well, and remains a good reference for most things, although the fourth (AR4) report is now in draft.

[Update: nowadays you'll likely prefer the AR5, its SPM, or the TS.]

This is a good place to point out that by "global warming" *I* mean the basic science, which is in IPCC parlance the WGI stuff. I don't mean the effects or adaption or the economics stuff that people spend so long arguing about (which are WGII and III stuff; if you don't know what WGI/II/III are, follow the IPCC link above). The ever-thoughtful Michael Tobis had a nice post addressing some of this in the early days of RealClimate. If I fling around the word "consensus" here and you wonder what I mean by that, then Just what is this Consensus anyway? will tell you.

Most of the links will tell you about how the climate is changing and suchlike. Few will explain to you the underlying mechanisms. A good (though now dated, to 1997) ref for this is Climate change: some basics.

Two areas that have seen a lot of attention since the TAR deserve special mention: tropospheric temperature trends; and the long-term temperature record. For the first, there was a puzzle about disparities between atmospheric and surface temperature trends. This now seems to be resolved in favour of the surface, models and std.global-warming: the old satellite temperature record was wrong (RC) and the supporting radiosonde (balloon) record was probably wrong too (RC again); the wiki [[Satellite temperature measurements]] is good too. The second is less resolved: [[Temperature record of the past 1000 years]]; Dummies guide to the latest Hockey Stick controversy, but happily the TAR take-home-message ("the increase in temperature in the 20th century is likely to have been the largest of any century during the past 1,000 years. It is also likely that, in the Northern Hemisphere, the 1990s was the warmest decade and 1998 the warmest year") remains valid in all reconstructions subsequently published. In a token piece of balance, and as a terrible warning of what happens if you obsess too much over trivia, I'll point you to www.climateaudit.org for the dark side.

If you want to *discuss* climate change, then the balkanised landscape of blogs is a poor place: the newsgroup sci.environment is better. James Annan explicitly directs people there rather than put comments on his blog, and thats a pretty sensible attitude. There are a variety of climate-type blogs I read linked on my masthead; RealClimate gets a special mention.

If you've got this far, you may be wondering "OK, thats the std view, but what about the other side?". It appears to be a fair question, but in fact isn't. As far as I'm concerned, thats the balance-of-science view (see here; for my look at the greeny side, try this; or the dark side). If you want the non-science view, you won't have any trouble: people ranting about climate change are all over the web (err, I'm over-egging the pudding there, of course. It is still (just about) possible to be scientifically respectable and doubt the consensus view. But the numbers of such are small, and shrinking (Lindzen has been rather quiet recently)). The wiki GW page will find you enough links, and various of the pages: [[List of scientists opposing global_warming consensus]] or [[Global warming controversy]] will find you more, if you want.

There are various GW myths that I've analysed: see 1 and 2 for some.

And thats it for this post. There's just time for a...

Wiki-Caveat: Most of the wikipedia pages about climate change are currently sane and have been stable for a fair while. That doesn't mean that they will still be sane when you read this post, but I'm hopeful. If you're interested in poking around in their history, click the little tab at the top marked "history". If you want to ask questions about them, click "discussion". And if you just know they are wrong or incomplete, then there is a little tab marked "edit". But bear in mind that people watch them; if you try to fill them with septic trash it will get taken out again.

2005-09-19

The arctic sea ice is not really a heat sink

My previous post Global warming 'past the point of no return' ?!? seems to have touched off a bizarre firestorm over whether the Arctic sea ice is really a "heat sink". I say, it isn't. Lubos Motl says it is. Since this is a question of climatology, we can reliably guess that Lubos is wrong (sorry, couldn't resist); even if we're not prepared to guess that I'm right. You can tell how much Lubos knows when he sez: William is one of the main people who define the "scientific consensus" about the climate. Wow, I never knew I had so much power: I must try using it one day...

So... my basic view (and its the correct one, ha ha) is that sea ice is an insulator, not a heat sink. In the winter ice-covered arctic, sea ice sits on top of an ocean whose temperature is about -1.8 oC, whereas the air overhead is about -30 oC (or something, I haven't bothered to check. Cold, anyway). If you cleared the ice away, the ocean would freeze over, of course. Heat conduction through the ice is slow and has more-or-less stopped by the time the ice has got to 1-2m thick (which is why ice thickness doesn't keep going up: the thicker ice comes from ridging). Hence, it acts as an insulator. Insofar as the teleological terms make sense, this is its climatic "function".

Lubos uses the old "google trick" to prove that people think the sea ice is a heat sink: just google "heat sink" "sea ice" he says. But this is a very old trick, and, as ever, throws up piles of hits with "sea ice" and with "heat sink" but no great relation between them. Of the hits, the top one is just the Indie article we're talking about. #'s 2,3 are quoting "The Arctic is the heat sink of the Northern Hemisphere" and *this* is fair enough (because of geometry, the tropics get more heat in, so heat flows from tropics to poles, so the poles are sort-of a heat sink). But thats the whole arctic, not the sea ice.

To point out the obvious, that Lubos seems to have missed: GCMs of course include the latent heat of sea ice in their calculations.

In fact, much of this disagreement rests on arguing about different things. If you are modelling sea ice, then yes of course you need to include the latent heat (if you don't, there is no control at all on whether the ice forms or not). And yes, the latent heat of fusion of a meter or so of ice is significant. But...

Trying to seperate out in more detail the heat capacity/latent heat stuff is more difficult. If you regard the ice as there, then the heat capacity is negligible (looking up the numbers, it seems to be about half that of the same mass/volume of water). If the ice isn't there, then yes its formation will indeed soak up heat. But... taking these fluxes in isolation won't work. Long-wave-down (not net) at the sfc in January is about 135 w/m2 so it would melt about 30m of ice in a day. Of course that neglects the long-wave up.

If you want to *store* heat then you clearly can't do that in the ice (since it would melt). And you have to take into account the seasonal cycle. To store it, it has to go into the oceans. And heat storage in the oceans is why the worlds warming is least in the great Southern Ocean around Antarctica and predicted to stay that way for a while.

Summary: calling the sea ice a heat sink, as the Indie does, appears to be a mis-paraphrase of "the *arctic* is a heat sink, which is what people do indeed say. Greg Kuperberg (who seems to do his best over at Lubos's comments) has already pointed this out.

[Update (sorry PF): Brian J points to a nice table from a recent Levitus paper (sorry JA). Then (with large caveats, but emphasising that they are probably overestimating the fusion term) they get for the change in heat storage) 18e22 for the ocean; 6e21 for the atmos (1955-96); misc other terms; 5e19 for the arctic sea ice (1978-96).]

[Update #2: I've struck out the 30m calc. I'm almost sure its out by a factor of 1000... somewhat surprised no-one has ripped it apart yet... I'll check in the morning]

[Update #3: For those of you visiting from Lubos Motls blog, let me point out that his version is seriously misleading and dishonest. The erroneous sentence which he bases his entire post around was struck out before he ever read this; I think he is trying to give the impression that I corrected my post based on his reply; but no. Also, Arun (see comments on this post, about #7) provides a nice link+quotes on the climate role of sea ice.

Meanwhile, for those interested in the status of string theory, this is interesting.]

2005-09-16

Global warming 'past the point of no return' ?!?

...or so says The Independent.

What they are talking about is the decline of Arctic sea ice over the last few years. Fair enough, it has, and (from memory) the trend is about in line with (pre|post)dictions.

One (one?) thing that looks odd in there is: the Arctic sea ice, the northern hemisphere's major "heat sink" that moderates climatic extremes. No. The arctic sea ice *isn't* a major heat sink. In fact, as the article makes clear a bit later... Sea ice reflects up to 80 per cent of sunlight hitting it but this "albedo effect" is mostly lost when the sea is uncovered. "We've exposed all this dark ocean to the sun's heat so that the overall heat content increases," he explained. Yes, thats right, *removing* the sea ice makes the ocean a heat sink, but with the ice in place its pretty reflective.

R2 and RE? Err, no.

JF asks for explanation of the R2 vs. RE statistical issue - what's necessary, what's sufficient, and why. This of course is Bartonism - question 7c, to be precise. The honest answer is, I don't know. And of course, neither does Barton. Take him away from his staffers and his notes and he wouldn't have a clue. So why is a US senator allowing himself to be used as a sockpuppet of a canadian mining consultant to parrot questions he doesn't understand? Politics, of course.

Mann responds that R2 isn't so useful because it measures the simple correlation, and doesn't assess the mean or standard deviation (i.e., if series A is 10 times series B, it would have a perfect r2 of 1, but wouldn't be a very good reconstruction). Mann prefers RE, whatever that may be... which sounds entirely plausible.

But basically folks, this is all a waste of time. Its like arguing with creationists about uranium-series dating, there will always be some tedious technical blind alley they will invite you to go down, while the rest of the world does more interestng things. Even the climateaudit groupies have realised this, with comments like "But isn’t it time to use your brain for something new?"

Oh dear... that tempted me into reading some of the CA comments. Try:

"I’m not a politician, but if I was, and saw replies that either ducked direct questions or gave woolly answers to them, then I’d be tempted to ask them for a little face time to discuss this."

This from someone who thought Mann was evasive. Funnily enough, Barton doesn't seem in any great hurry to hold any hearings, having got his fingers badly stomped on by Boehlert (more).

Power plant costs. And hurricanes.

The Economist (sept 17th) has an article (sub req) on electricity generation, and a nice graph of the capital costs of various power plants. Gas (as we all know) is cheapest (about 250 GBP/kW); biomass and nuclear are the most expensive (900-1200 kW). Remember, these are capital costs and don't include fuel and ongoing expenses (it doesn't say if nuclear include decommissing). The interesting point (to me) is that *offshore* wind turbines come in cheaper (7-800 kW) than nuclear. Given that you then have to load on top the fuel, and probably decommissioning, and vast angst, who would want to build a new nuke plant? OK, the answer might be base load (yes they do mention that) but for anything above that, there seems (from the economist graph at least, its not a moral that they draw in the article, oddly enough) to be no excuse for building nukes. Coal is 6-700 kW (dirty; or 7-800 if clean), which probably pushes it above wind if fuel costs are included.

They also have an article on the hurricane stuff (which I've read) about the Webster paper in Science (which I've just skimmed). But the abstract is:

We examined the number of tropical cyclones and cyclone days as well as tropical cyclone intensity over the past 35 years, in an environment of increasing sea surface temperature. A large increase was seen in the number and proportion of hurricanes reaching categories 4 and 5. The largest increase occurred in the North Pacific, Indian, and Southwest Pacific Oceans, and the smallest percentage increase occurred in the North Atlantic Ocean. These increases have taken place while the number of cyclones and cyclone days has decreased in all basins except the North Atlantic during the past decade.

...hurricanes in the strongest categories (4 - 5) have almost doubled
number (50 per pentad in the 1970s to near 90 per pentad during the past decade) and in proportion (from around 20% to around 35% during the same period)...

We conclude that global data indicate a 30- year trend toward more frequent and intense hurricanes... This trend is not inconsistent with recent climate model simulations that a doubling of CO2 may increase the frequency of the most intense cyclones, although attribution of the 30-year trends to global warming would require a longer global data record and, especially, a deeper understanding of the role of hurricanes in the general circulation of the atmosphere and ocean, even in the present climate state.


Well, interesting stuff, somewhat complementary to Emanuel. A thing that struck me, and isn't mentioned in the Econ or Science (as far as I could see) is that "hurricanes only form when SSTs are over 26 oC", and the region with the most obvious increase is the N Atl, which has the lowest SSTs, and so might be "unsaturated" and more liable to increase (whatever that might mean).

2005-09-14

Bee orchids

James Annan rates highly (currently #2) for Spencer and Christy (I'm #1 for "S+C msu" but thats a bit contrived) and John Fleck is good for weird cheap shit :-) BUT my website is #1 for "bee orchid" (admittedly on image not text).

This post in return for JFs asters. I didn't grow my bee orchid, of course.

And just to keep the betting stuff alive... I've added a note to my wiki page - you can edit that, of course.

2005-09-13

Soil carbon losses in England and Wales

A reader (in fact, the authors wife: which is why this jumps the queue :-) asks: what about Loss of soil carbon 'will speed global warming' (Tim Radford, Thursday September 8, 2005 The Guardian).

It says:

England's [Ahem. And Wales's - WMC] soils have been losing carbon at the rate of four million tonnes a year for the past 25 years - losses which will accelerate global warming and which have already offset all the cuts in Britain's industrial carbon emissions between 1990 and 2002, scientists warn today.

The research dashes hopes that more carbon dioxide emissions might mean more vegetation growth and therefore more carbon removed from the atmosphere.


The Guardian report even includes the nice "The study confirms the value of long-term research" - how very true. There is some evidence that this message has already been lost: the survey is a trend from original sampling (1978-83) and resampling (1994-2003), but only about 40% if the original sites were resampled.

A summary of the paper (Carbon losses from all soils across England and
Wales 1978–2003 Pat H. Bellamy, Peter J. Loveland, R. Ian Bradley, R. Murray Lark & Guy J. D. Kirk, Vol 437|8 September 2005|doi:10.1038/nature04038) is here, and a PDF of the Nature article is here. I wonder if Nature know that...

So: back in 1973 some far sighted individuals set about dividing England and Wales ino a 5km grid of about 6000 sites: 5662 were sampled for soil, in particular soil organic carbon, between 1978-83. Between 1994-5 the arable was resampled (only 853 of original 2578); between 1995-6 permanent grassland (771 of 1579); 2003 for non-agricultural (bogs, scrub, etc: 555 of 1505). Now this means we're drawing a trend (at each gridcell) using two points in time, and not the same two points either for all the cells. We'll quietly forget that from now on.

The paper notes that this is the only survey like it anywhere in the world. Its probably only possible in a densely populated rich country like England/Wales. Ideally we would have this globally: but there is no hope of that. In particular, I can't see any way to tie soil carbon changes to Kyoto commitments (without kludging it badly, which people wouldn't accept), because the data just isn't available.

Figure 1 shows you how closely C loses match up to C content (fig 3). Because they found no significant relations between C loss and land use, they don't believe that land use changes have caused the loss (England/Wales being heavily human-influenced, this is a natural first guess). Which is why they settle on climate change as the most likely explanation.

On the offsetting of Kyoto savings, this is less satisfactory. Firstly I'm not convinced that tying the two together makes much sense. Secondly the 13 Tg/y figure thats based on comes from two extrapolations. The survey was from Engalnd and Wales, top 15cm of soil. Firstly they say *if* the same is happening in the 15-30 cm layer; and then *if* we extrapolate to Scotland; we end up with 13 Tg/y. 13 Tg/y is the Kyoto cuts, so notice how the Grauniad quote has somewhat confused that issue. They do note, though, that Scottish soils tend to be carbon-rich and if anything this estimate might underestimate losses. But there is also a comment that they don't really know where the C from 0-15 cm has gone. Into the atmos is a reasonable guess; but leaching into lower layers is also possible. In which case the 15-30 cm layer might not be comparable at all.

The obvious thing to do would be to extrapolate these results across the whole temperate land area. I rather suspect that if you did, you would find results for C loss too large to be plausible, given the atmos C record. But thats a guess.

The Grauniads second para - about dashing hopes of inc veg - seems a bit curious. This study doesn't rule out increased forest growth, for example (it probably suggests it). The paper says "On the basis of atmospheric observations, net carbon absorption by terrestrial systems in the Northern Hemisphere has increased in recent decades" so presumably some of this C has gone into veg elsewhere.

Larger scale studies, and integrated carbon budgets, are needed.

[Update: by chance (?), Rising Atmospheric CO2 Reduces Sequestration of Root-Derived Soil Carbon by James Heath et al. has just appeared in Science, Vol 309, Issue 5741, 1711-1713 , 9 September 2005. ...We show that carbon dioxide enrichment, although causing short-term growth stimulation in a range of European tree species, also leads to an increase in soil microbial respiration and a marked decline in sequestration of root-derived carbon in the soil. These findings indicate that, should similar processes operate in forest ecosystems, the size of the annual terrestrial carbon sink may be substantially reduced, resulting in a positive feedback on the rate of increase in atmospheric carbon dioxide concentration. This is only a short term study with an artifical environment (as they note in the paper) but its in the same direction].

2005-09-10

Probably not betting on climate with Lubos Motl

James Annans stuff refers.

Lubos Motl is a string theorist who thinks his opinions on GW are worth something [1]. Normally they aren't, but since he believes that warming and cooling are equally likely in the future, there is scope for a bet in which both sides think they are getting good odds.

James already has even odds on warming/cooling over the next decade from some unwise Russians, which is a good bet if you can get it (I've offered to share the exposure with him but he isn't taking; I'd even offer a premium). Lubos doesn't offer even odds (he isn't stupid, after all). He is looking to bet on a straight warmer/cooler from 2003 to 2013. He reasons that those who accept the consensus would think the odds of this to be about 1:100 on warmer; his odds are 1:1; so splitting the difference with a geometric mean gets 1:10 and he offers a bit less than this.

The trouble is interannual variability. The shorter the time period, and the fewer years for your endpoints, the more chance of the "wrong" result coming out even if the overall trend is upwards. To illustrate this, here is the CRU annual global temperature record (click for larger version). The bottom pic is a blow-up from 1970 (arguably the warming didn't start till the mid-70s due to sulphates, so I'm slightly doing myself down by starting from 1970, but no matter, I fudge that later), the two red stars (and the green ones ten years later) show the (as it happens, two) pairs of years when the temperature 10 years later was cooler. Since we all agree that the data since 1970 show warming (even those who believe the data is contaminated by UHI, alien spaceships and bits of string still agree that the data displayed show warming). If you choose a predition-time of 5 instead of 10 years, then there are 12 such pairs (5 is particularly bad: the values are (13=0; 12=1; 11=2; 10=2; 9=3; 8=3; 7=2; 6=9; 5=12).

So anyway, a rather rough calc (projecting the past into the future) then gives odds of cooling between 2003 and 2013 at about 2-3 to 25. Lets call it 1:9 (i.e. I think a fair bet is me putting up 9X for a chance of winning X; then my expected gain is 9/10*X-1/10*(9X)=0). So taking geometric averages (which Lubos asserts is "fair") gives odds between me and Lubos at about 1:3.

Lets do a quick sanity check on whether 1:3 seems fair to us both. If Lubos is right (in his assesment of the odds as 1:1), his expected gain is 0.5*3X-0.5*X = X. If I'm right (at 1:9) my expected gain is 9/10*X-1/10*3X = 6/10*X. Oops. Wrong: they should be the same. So we require odd 1:y such that 0.5*y-0.5 = 9/10-1/10*y, i.e. (y-1)/2 = (9-y)/10, i.e. 12y = 28, y = 7/3 (quick check: (7/3-1)/2 = 2/3 ?=? 2/3 = (9-7/3)/10 yes). In which case our expected gains are both 2/3 of our stake. So it looks like geometric averaging is wrong. Interesting, because it sounded plausible. I think that equalising expected gain is the way to get a fair bet, and the error in my calc above isn't immeadiately obvious. Also it pushes the odds into my favour, so I'll leave it for the moment.

So there we are: I offer Lubos (or anyone else credible) odds of 3:7 that 2003 is cooler than 2013 (ie, if 2013 is cooler I pay over 7*X; if its warmer I get 3*X; X negotiable but at least 500; currency dollars or pounds). I have (rather faint) hopes of getting better odds out of Piers Corbyn, so anyone interested had better strike now while the iron is hot & before I discover the flaw in my logic above...

OTOH difference-of-two-years is a noisy statistic. A better bet is on trends. From the above data, the trend is about 0.18 oC/decade. For the future, Lubos predicts a trend of 0; I predict same-as-the-past; splitting the difference, what about an even-odds bet on a trend, between 2003 and 2013 (inclusive; standard LS fitting) of above/below 0.09 oC/decade? As it happens, doing that since 1970 produces 3 11-year periods when the trend has been less than 0.09. I'd be more comfortable with trends. For one thing, it makes the bet more interesting, as you can compute the trends out at 5,6,7,8,9 years with some hope of guesing the 10th; whereas with diff-of-years the last is less predictable so the tension is less.

Bush is a disaster...

From Snopes via James Annan:


[Note: if you saw a sick green face, then so did I, and I'm confused: do they keep changing it? I've replaced the direct Snopes img with an indirect one (to JA's cached one, in fact) - WMC]

2005-09-06

Bush to lead inquiry into Katrina

Radio 4 says: "Bush to lead inquiry into Katrina: US President George W Bush says he will lead an inquiry into how the Hurricane Katrina disaster was handled."

I can see it now: "So George, did you totally f*ck it up?". "No George I didn't". "Well George, that seems fair enough: after all, you're a complete bozo, who would expect you to do anything useful?".

At least in the UK we put a thin veneer of honesty over the process by getting a nominally independent judge who can be relied on the discover the right things, rather than let people investigate themselves. Banana republic, anyone?

[Update: Miriam points out this: "So I'm asking Congress, please investigate this now. Take whatever idiot they have at the top of whatever agency and give me a better idiot. Give me a caring idiot. Give me a sensitive idiot. Just don't give me the same idiot."

GW, methane and vegetarianism: http://www.earthsave.org/globalwarming.htm

A reader would love to see http://www.earthsave.org/globalwarming.htm dissected. Hmm. Well, speaking as a vegetarian I'm all in favour of it, but for moral / animal welfare issues. The "vegetarian footprint" is smaller than a meat eaters, but is it really enough to be a factor in GW? Lets read on...

Global warming poses one of the most serious threats to the global environment ever faced in human history. Yet by focusing entirely on carbon dioxide emissions, major environmental organizations have failed to account for published data showing that other gases are the main culprits behind the global warming we see today. As a result, they are neglecting what might be the most effective strategy for reducing global warming in our lifetimes: advocating a vegetarian diet.


Hmm, hyperbolic, and as a first guess they are just using GW to push their pet idea, but I guess they have two points they are asserting:


  1. Methane is more important than CO2
  2. Meat eating is a major source of methane


Both of those sound dodgy, so how do they back them up?

Firstly, the radiative stuff. The IPCC fig 3 shows methane as about 0.5 w/m2, ie about 1/5 of the well-mixed GHG forcing and therefore about 1/3 the size of CO2. Earthsave are relying on Hansen, PNAS to bump the methane up from 0.5 to 0.7 by adding in some of the tropospheric ozone and (it looks like) all the stratospheric water vapour forcing, so making methane about 1/2 of CO2. Hansen then attributes sulphate aerosol, etc, to fossil fuel combustion (fair enough) and then offsets this against CO2 (hmmm) and then asserts that "the processes producing the non-CO2 GHGs have been the primary drive for climate change in the past century". Not very sure about that, but probably not much use even if true in predicting the future forcing, because sulphate to CO2 ratio is predicted to decline. Also, Hansens version of aerosol forcing seems to be rather larger than other peoples, which is why (I think) he gets them offsetting CO2. Compare the IPCC (aerosol indirect effect) with Hansens equivalent (forced cloud changes) and the range is similar, but the IPCC writes "very low" for the confidence; the range includes zero; and (AFAIK) the effect is entirely absent from the GCM studies that end up reproducing the cliamte change of the past century. On Hansens figure the range no longer includes zero; the confidence is unqualified; and there is a nice blue bar drawn down to -1 to guide your eye to the obvious conclusion.

Now its possible that Hansen is right, but I don't think its fair to represent his views as mainstream (earthsave tells me that Hansens results are generally accepted by global warming experts, including bigwigs but I'm not a bigwig, so I wouldn't know; they also reference the UCS review in their favour, but earthsave's version "the Union of Concerned Scientists had the data reviewed by other climate experts, who affirmed Hansens conclusions" is a misrepresentation of the UCS's far more tentative position), although this is a bit out of my area so I'm unsure. And even he doesn't think the CO2/aerosol balancing (as he would put it) can continue. Comments from the lurking Schtick welcome.

So... methane bigger forcing than CO2, dodgy (and then they totally lose my sympathy with "Whereas human sources of CO2 amount to just 3% of natural emissions..." which is septic garbage). What about the second point: "the number one source of methane worldwide is animal agriculture."? They reference the US EPA for this (which is odd, because they say *worldwide*, then ref the EPA US-only figures), who say "Methane is produced primarily through anaerobic decomposition of organic matter in biological systems. Specifically, methane is emitted as a result of the decomposition of organic wastes in municipal solid waste landfills and from agricultural and biological processes related to wetland rice cultivation, livestock digestion, and waste production. Methane emissions also occur during the production and distribution of fossil fuels such as coal, natural gas, and petroleum". But under the "agriculture" heading they say "The normal digestive processes in ruminant livestock (known as enteric fermentation [known as cows farting - WMC]) account for the largest portion of methane emissions.". So from this I guess that most of the *US* agricultural methane comes from cows, but probably not most of the total methane; and the global picture is likely to be different (and remember, Hansens figures were all global, so I don't think going back to a pure-US view is defensible). In fact, the table lower down resolves the uncertainty: the largest (in the US) is landfills, at 131 (Tg CO2 equiv in 2003); natural gas systems at 131; and cows farting at 125. And the total is 545. And globally? I don't know. wiki says 17% from cows, but cunningly doesn't venture whether this is global or not; the implication should be that it is. Ah... but http://cdiac.esd.ornl.gov/trends/meth/ch4.htm says "For flaring and venting of natural gas, estimated methane emissions rose from 0.0 in 1860 to a maximum of 29.3 million metric tons in 1973, then declined. For oil and gas supply systems, excluding flaring, estimated methane emissions rose from 0.0 in 1860 to a maximum of 18.0 million metric tons in 1994. For coal mining, estimated methane emissions rose from 2.2 million metric tons in 1860 to 49.5 million metric tons in 1989, then dropped slightly. For biomass burning, estimated methane emissions rose from 9.8 million metric tons in 1860 to 38.0 million metric tons in 1988 and subsequently declined slightly. For livestock farming, estimated methane emissions rose from 25.6 million metric tons in 1860 to 113.1 million metric tons in 1994; this appears to now be the largest individual anthropogenic source of methane emissions, having overtaken rice farming in the early 1980s. For rice farming and related activities, estimated methane emissions rose from 40.1 million metric tons in 1860 to 100.8 million metric tons in 1994. For landfills, estimated methane emissions rose from 1.6 million metric tons in 1860 to 40.3 million metric tons in 1994. Total estimated anthropogenic methane emissions rose from 79.3 million metric tons in 1860 to 371.0 million metric tons in 1994. During the period 1860-1994, the relative importance of the various component sources changed, with fossil fuels increasing and agriculture - although still dominant - declining in dominance. Within the agricultural sector, livestock replaced rice as the leading component."

To summarise that lot: yes they are probably right: livestock probably is the major source of methane, but is only about 1/4 of it. Then they continue: "Simply by going vegetarian (or, strictly speaking, vegan), we can eliminate one of the major sources of emissions of methane..." errrrmmm yes, good point there folks, and probably a good idea not to put it at the top: you need to be vegan to get rid of the cows, not just veggie; and not many can cope with becoming vegan (I couldn't). More: "there is no limit to reductions in this source of greenhouse gas that can be achieved through vegetarian diet. In principle, even 100% reduction could be achieved with little negative impact". Well no, this is wrong: since cows are only about 1/4 of the methane sources, you can only cut out 25% even with the whole world vegan. More: "efforts to cut carbon dioxide involve fighting powerful and wealthy business interests... vegetarian foods are readily available, and cuts in agricultural methane emissions are achievable at every meal" sounds like wishful thinking to me.

Conclusion: they probably have a reasonable point but they push it too far.

2005-09-05

Hurricanes and SST, technical

The RC "Katrina" post is up - go look and comment, if you haven't already. I want to talk about one issue, see comment #34 Higher temperatures mean higher energy levels, but in thermodynamics, it is the difference in temperatures that determines how much power a system outputs... explain the temperature difference that drives hurricane systems and how GW is expected to increase that temperature difference. The point being, is it *SSTs* going up that you expect to drive more hurricanes, or is it the *difference* between SSTs and "the top", whatever that might be? My answer was Much of the power for the hurricanes comes from latent heat: the condensation of atmospheric moisture as air parcels are raised. Warmer air leads to more moisture (roughly exponentially), so no T diff would be needed and I still like it, but it doesn't seem to have found much favour. Isaac Held said it is temperature differences that are fundamental, and not, for the most part, the temperature itself... It is the temperature difference between the ocean surface and that of the upper level outflow that is crucial. From this perspective one can see that the issue of hurricane intensity is linked with that of trends in upper tropospheric temperatures.... To which I reply I'm sticking with my view for the moment, bolstered by the fact that everyone seems to correlate hurricanes against SST and I've never seen anyone correlating them against upper temps....

From this, I hope its clear that I'm unsure about all this... if anyone feels inclined to supply useful info, please comment.

So: the idea that everyone is talking about SSTs and no-one is talking about upper air temps is meta-evidence that they don't much matter, but that is not in itself terribly convincing. What I want to do is look at some nice words by Kerry "intensity" Emanuel himself. See http://wind.mit.edu/~emanuel/anthro2.htm (which will, if you look carefully, link you to a PDF of his Nature paper if you want it). And in fact the one we want turns out to be this about theoretical max intensity, and the section physical basis of limit calculations.

First off, the efficiency E is (T_s - T_0)/T_s. T_s is the "heat source" - the ocean; and T_0 is the exit temperature. So at first sight this is promising for the "upper air"-ists. But wait... equation (4) is for the max wind speed, but T_0 has gone and T_s is still there. OK, its because T_0 is wrapped up in E. And... "Finally, one has to estimate E. To do this, one has to first estimate T_0, the temperature at which air flows out of the top of the storm; this is also equivalent to estimating the altitude of the storm top. This accomplished by finding out how high up in the eyewall the air remains warmer than the distant environment, and is straightforward to assess given the vertical profile of temperature in the storm environment." Which I take to mean that he is doing some parcel-ascent calculations based on T_s and the atmos profile.

Lets also try a PDF of a Nature paper of his from 1987 here. Again, we have the E factor (e.g. eq (1) or (4)). Again, the calc of E has come from T_s, profiles, and parcel ascent. And a bit later we get, paraphrased, "The pattern of intensity largely matches the SST pattern, but non-linearly, because E is largely a function of the SST". Then he goes on to argue that the portion of changes in intensity (under climate change) due to climatic changes in E will be small.

So... all in all I still think I'm right and Emanuel agrees with me. But I'm willing to be told otherwise, if you know better.

ps: I haven't forgotten my two questions in the Q.

2005-09-01

Prez Bush is going to fly over Louisiana in a helicopter tomorrow!

...says the BBC r4 news tonight. And do what, I wonder? Put his thumb to his nose and go "nyah nyah, I'm floating around in a chopper and you're stuck in a flood"? How does this fit in with the other comment of his that they reported, that people should avoid unnecessary fuel use at the moment?

And just for balance, I'll also throw a brickbat at the ?Danish? env agency which has been shipping people off to Greenland for a jolly to look at retreating glaciers. Which is pointless. You can't *see* a glacier retreating from a visit, but you can by sitting at home comparing old and new photos. And you discover nothing about GW by looking at any one glacier. But option 2 isn't much fun and won't get you press coverage. It won't waste fuel and resources either, though.

Spam and comment verification

I've suddenly started getting spam comments. Deleting them is tedious, so I've taken bloggers advice and turned on "comment verification" which means you have to type in a bit of text before you get to comment. Sorry about that. It might not force you to do it if you're a registed user... let me know.

Hurricanes and Global Warming

For some odd reason the question of the linkage, or otherwise, between hurricanes and global warming is in the news at the moment. As to the details, I have rather little to say, on the grounds that hurricanes in the Antarctic are unknown. I will recommend this RC post if you're interested; also RP Jr has quite a bit to say about the issue recently. But I do want to make a comment about the attribution question. As far as I can tell, while its premature to say: "an increase in hurricanes can be attributed to global warming", its equally wrong to say "global warming has had no effect on hurricanes".

Which is why I find RP Jrs latest rant on ceding the high ground odd, because he apparently approves of James Glassman at TCS who sez Katrina has nothing to do with global warming. Nothing. Approving of anything on TCS is a strange thing to do, and I can't see why this one should be approved of. It looks like some kind of reverse-fallacy to me: failing to attribute to GW doesn't do the reverse, ie it doesn't demonstrate a lack of connection. Is it perhaps the "unexcluded middle" fallacy?

Having said that, the perceptive will notice that I welcome RP Jr back onto my blogline, and Sr (and not just because I got him to nuance his nuances a bit more).

Finding and Looting

How do you tell a "looter" from a "finder"? Its easy. See this from Wonkette (thanks Dave Mason via Planet Fleck).

Meanwhile... all this Katrina stuff (very interesting, true) and then... another 800 dead in Iraq, and not even for any kind of sensible reason: just a mass stampede. The madness of crowds.