In conclusion, Mr. Connor [the Indie journo] has “jumped the gun.” I am firmly convinced that at least part of what we are seeing in the Arctic is due to human influences. However, sensationalist articles like Mr. Connor’s only serve to further polarize what is already a very polarized issue... I feel “ambushed” by Mr. Connor’s article.
So... whats up? Firstly, RP Sr seems to like the UI seaice data, I don't know why. As SB points out in a comment here they were wrong a while ago when they disagreed with NSIDC. To introduce yet another source, I'm going to use the NCEP product for this post (because its easily available; probably the answer to my RP question above is that the UI product is easily available for his purposes), though (as I pointed out here) I actually prefer the Bootstrap to the NASA Team product, at least for the Antarctic. also (for fans of important-but-boring detail) I'm going to use total area for my trends, not extent. Its all different ways of processing the same [[SSMI/SSMR]] dataset, anyway.
NSIDC has a press release out Sea Ice Decline Intensifies Summer Arctic sea ice falls far below average for fourth year, winter ice sees sharp decline, spring melt starts earlier which has some nice pics in it and some useful discussion by scientists (I'm doubtful about "The persistence of near-record low extents leads the group to conclude that Arctic sea ice is likely on an accelerating, long-term decline" early in the piece, I suspect that was put in by the PR folks. Its not really supported by the graph just next to it, which shows 2005 as low, but not really far below the trend line. Having said that, if their fig 2 is correct, the ice does seem to be unusually late recovering this year). Why they felt the need to put it out today, rather than waiting a few more days until the end of september, I don't know. Anyway, sea ice doesn't change that much over a few days so their pic is probably going to be correct at the end of the month. RP says that NSIDC haven't made sept available: but the NCEP GRIB is available in realtime from ftp://polar.ncep.noaa.gov/pub/cdas/ for anyone with the patience to convert it (you want wgrib, if you want to convert it, which you don't want to do...).
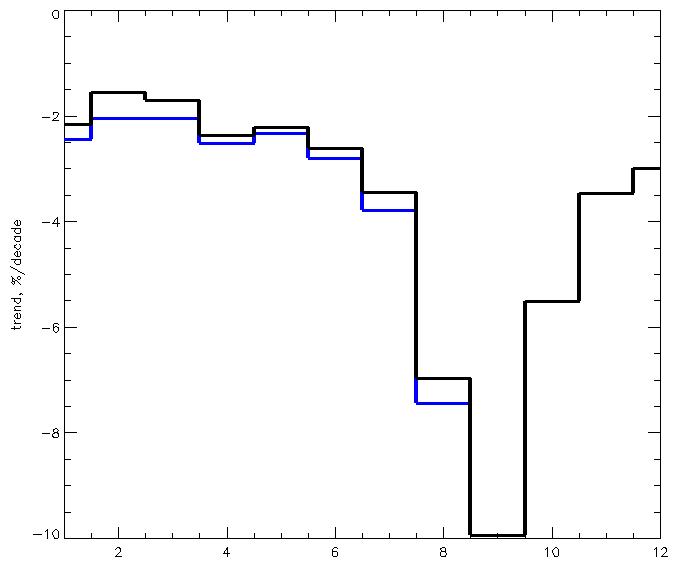 So *my* contribution to this is the piccy here, which shows sea ice area trends (% per decade) from the NSIDC (thank you Bob) dataset from 1979-2004 (black) and -2005 (blue) up to august. Because in all this the fact that the trends are quite seasonal is being missed a bit. Note that my trend for september is about 10%; NSIDC say about 7-8% depending exactly on which year you stop. The difference is probably due to me using area rather than extent (a quick test says that switching to extent reduces my trend by about a factor of 1.4).
Oh... and the usual caveats apply. I've checked my pic a bit but I did this all in an hour at home tonight, so if anything looks madly wrong to you, you may well be right.
[Update: and the *other* thing I was going to say which I forgot was... this is all pretty well in line with the model results, as far as I can remember them. I'm thinking of Recent and future changes in Arctic sea ice simulated by the HadCM3 AOGCM by Gregory, J. M.; Stott, P. A.; Cresswell, D. J.; Rayner, N. A.; Gordon, C.; Sexton, D. M. H. So the attribution of the trend to GW seems reasonable.]
13 comments:
Normally, one would expect that a "modeller" from the British Antarctic Survey like our friend WC should usually write about Antarctica.
So why is he writing about Arctica which is just the opposite ;-) of his job? Well, Antarctica is no good for your scam, Gentlemen, is it? Ice is growing there and it is a bad news for global warming and for the billions of dollars that global warming is stealing from the taxpayers.
So I guess we will be hearing about Arctica only.
Lumo, you really ought to check some facts before posting. As far as even I can make out, GW theory predicts growing ice in Antarctica and this is (mainly) happening.
Over at http://www.climateprediction.net/board/viewtopic.php?p=30290#30290
I asked people what they interpreted from the http://nsidc.org/news/press/intensifies/images/figure1.gif graph. Is this year a good one for making the graph look alarming?
I would guess that the pattern I point out is not statistically significant so it is just too early to know. I also think they may well have seen this as a possibility and that is why they are suggesting as long as 2100 before ice free in summer.
crandles
The figure you have constructed is only a chart of the ice up until August. What is remarkable, and is the thrust of the news release, is the extent of the September ice. If you had aded that, it would have gone off the bottom of your chart! However, the main point is that the ice is not recovering after the summer melt. What you have got to understand is that this fits with what Brooks wrote 50 years ago. A large area of multiyear ice is needed for the winter ice to reform. It looks as if we may have reached the point where the minimum ice area is too small for the winter ice to regrow. But even if that is an exageration, what will happen next year? With a smaller starting pack this autumn, the spring pack will also be smaller. Next September, after yet another record melt season, will the multiyear ice then be large enough to regrow?
THINK about it!
Cheers, (anonymous) Alastair.
William- thanks for reading my blog. We have referred to the University of Illinois data since I developed quite a bit of respect for the scientific capabilities of Bill Chapman as we completed our paper on Arctic and Antarctic sea ice coverage (Pielke Sr., R.A., G.E. Liston, W.L. Chapman, and D.A. Robinson, 2004: Actual and insolation-weighted Northern Hemisphere snow cover and sea ice -- 1974-2002. Climate Dynamics, 22, 591-595 DOI10.1007/s00382-004-0401-5.). I also greatly respect the research analysis of Mark Serreze of the National Snow and Ice Data Center (NSIDC). The media, however, has not included the University of Illinois Analysis in their discussion. They have also not related to Antarctic sea ice coverage (which I discuss in today's blog at http://climatesci.atmos.colostate.edu//). This is cherrypicking by the media.
We agree that humans are altering the climate system. My perspective, however, is that global warming, and climate change in general, are much more complex than simply relating to just the anthropogenic increase of the well-mixed greenhouse gases. This broader perspective was articulated in the 2005 National Research Council report (National Research Council, 2005: "Radiative forcing of climate change: Expanding the concept and addressing uncertainties". Committee on Radiative Forcing Effects on Climate Change, The National Academies Press, Washington, D.C., http://www.nap.edu/openbook/0309095069/html/).
Thus we need to better understand why the Arctic sea ice extent is diminishing before conclusions are cavalierly presented in the media that summer ice will disappear in the next several decades. This winter's sea coverage will be a valuable test of whether the trend will continue of not.
Hi Roger. I've just read your post. Arctic sea ice loss is clearly interesting. "not much happening in antarctic" is clearly less entertaining.
But you say: "If this news article were accurate, and it is global warming (i.e., a global scale warming) that is causing the well below average summer ice cover in the Arctic... we would also expect to see reductions of the Antarctic sea ice coverage"
I don't agree. You're not naive enough to take "global warming" to mean globally-uniform warming. GW, in this context, means the warming from GHGs (thats not precise but it will do for now). AFAIK the model predictions for the Arctic and Antarctic are very different. For example, TAR 9.3.2.
So in that sense, what we see is fully consistent with the models.
For the Antarctic ice trends... I think I'll re-do my figure for the Antarctic.
A follow up comment... firstly I didn't mean to be impolite about UI. My text in the post is badly phrased. All I meant was that I didn't know why you liked it (without any implication that there was anything mysterious going on). I don't see why the press should pay much attention to which SSMI series they use though... to a large extent these things are reliable to the extent that they say the same thing.
Antarctica: I've realised this is a bit more work that I thought. There is a Comiso and Steffen paper that applies "data from 1978 through 2000 also show a slight but insignificant positive trend of 0.17 +/- 0.33%/decade in ice extent" but I think it may have become sig since, and possibly there is a more recent paper.
Hi William
Re: “I don't agree. You're not naive enough to take "global warming" to mean globally-uniform warming. GW, in this context, means the warming from GHGs (thats not precise but it will do for now). “
As I discussed on my blog (see my August 26 entry on global warming with respect to my response to Andy Revkin of the New York Times http://climatesci.atmos.colostate.edu/index.php?paged=2) global warming involves other climate forcings besides the well-mixed greenhouse gases. Certainly, as a result of these more spatially heterogeneous climate forcings, the spatially variable importance of the climate forcing of the well-mixed greenhouse gases, and the diversity of climate feedbacks, the actual geographic climate response should be expected to be complex.
However, the TAR 9.3.2 Antarctic results that you cite indicate that a reduction of sea ice thickness (and presumably areal extent) is generally predicted by the models. In terms of the ice-albedo feedback to the atmosphere, the current asymmetrical trend between the Northern and Southern Hemispheres is not consistent with the model results, and requires an explanation.
"global warming involves other climate forcings besides the well-mixed greenhouse gases."... technically true (by all the usual definitions) but it might well be helpful to think of GW as GHG-aerosols, and the rest of the forcings as something else.
Re the TAR results... are we looking a the same figure. Those results clearly show that Arctic trends are expected to be far more positive than Antarctic ones, and in that sense are consistent with what is happening today.
I hadn't realised they were thickness... extent would be more useful.
But anyway, that graph is for today compared to 2050, so it can't be used exactly.
Since I have the AR4 runs (or at least access to them) I shall try to produce a more accurate figure which would be based on what the C20C runs produce for current trends.
William: I don't think I understand, don't current observations suggest a negative negative trend in antarctic sea ice rather than the predicted positive negative trends to which you linked?
OT: I well enjoyed your photoblog. Re: the daisy shot, how big was that daisy? What a meniscus, that water must have been *cold*!
CSea: I was under the impression that Ant trends were positive, but insignificant. A quick poke around with the data seemed to suggest otherwise (ie, that they look large enough to be sig, though I haven't done any proper sig tests), but I really must check it more carefully.
Photos: thanks. The photo was taken in the Pyrenees in ?June? The weather was very warm, but the water was chilly.
He's baaaaack (although there seems to be a much higher than average use of conditional terms as regards his conclusion):
GEOPHYSICAL RESEARCH LETTERS, VOL. 32, L16712, doi:10.1029/2005GL023429, 2005
Variable solar irradiance as a plausible agent for multidecadal variations in the Arctic-wide surface air temperature record of the past 130 years
Willie W.-H. Soon
Harvard-Smithsonian Center for Astrophysics, Cambridge, Massachusetts, USA
Abstract
This letter offers new evidence motivating a more serious consideration of the potential Arctic temperature responses as a consequence of the decadal, multidecadal and longer-term persistent forcing by the ever-changing solar irradiance both in terms of total solar irradiance (TSI, i.e., integrated over all wavelengths) and the related UV irradiance. The support for such a solar modulator can be minimally derived from the large (>75%) explained variance for the decadally-smoothed Arctic surface air temperatures (SATs) by TSI and from the time-frequency structures of the TSI and Arctic SAT variability as examined by wavelet analyses. The reconstructed Arctic SAT time series based on the inverse wavelet transform, which includes decadal (5–15 years) and multidecadal (40–80 years) variations and a longer-term trend, contains nonstationary but persistent features that are highly correlated with the Sun's intrinsic magnetic variability especially on multidecadal time scales.
Received 9 May 2005; accepted 29 July 2005; published 27 August 2005.
Oh wonderful. I suppose I'll have to read it now. In the hope of not having to :-), I've posted a thread to sci.environment to see if anyone lese has.
Thanks for pointing it out, though.
You have a great blog. Try this one hypnosis products
Post a Comment