2005-10-26

The political post

I do one every now and again. The Steve Bell cartoon in todays Grauniad triggers this one...


I don't know if that will work past tomorrow... If you're wondering about the ?, then maybe you need Deltoid.

Also, I just found (via Dynamics of Cats) this.

WSJ: Yet more Jolly Hockey Sticks, and Barton, et al.

There is a WSJ article "Global-Warming Skeptics Under Fire" (love the title...).

Anyway, the initial point is that it contains some quotes from various parties:

One study, from researchers at the GKSS Research Center in Geesthacht, Germany, confirmed "a glitch" in Dr. Mann's work but "found this glitch to be of very minor significance" when applied to some computer-generated models of climate history, according to a statement released by lead author Hans von Storch.

The other study, by Woods Hole Oceanographic Institution fellow Peter Huybers, argued the Canadians had overstated the effect of the problem. "The truth is somewhere in between, but closer to Dr. Mann," Dr. Huybers said. Both Dr. Huybers and Eduardo Zorita, a collaborator of Dr. von Storch, agreed they had yet to address all of the Canadians' criticisms.

The complex debate, which turns on statistical technicalities, isn't likely to end soon. In replies published in the same issue of the journal, Mr. McIntyre and Mr. McKitrick defended their conclusions. "We are not withdrawing an inch," Mr. McIntyre said in an interview.

The dispute was the subject of a page-one story in this newspaper in February.

Some scientists believe the dispute has more political weight than scientific significance. That's because, they say, other studies of past temperatures also indicate they are higher now, on average, than at any time in past 1,000 years, and perhaps far longer. "A number of studies all come to the same conclusion," Dr. Mann said.


However the WSJ, as is traditional, makes the usual mistakes: The new findings are the latest round in a politically charged dispute over the "hockey stick," a widely publicized graphic showing that temperatures during the late 20th century were likely higher than at any time in the past 1,000 years.. *All* the reconstructions show this, not just the MBH versions.

But also interesting is a statement from Bartons committee:

Mr. Neal said the committee staff hasn't yet begun a detailed analysis of the information it collected from scientists.


Hasn't yet begun? What are these people up to? They demand all this stuff and then do nothing with it? Well, OK, so the answer is obvious: having been slapped down by various people, including and number of scientists and by Boelert (sp?), Barton issued an aggressive statement some while back... and then ran away. However, if anyone has sightings of Barton actually doing anything on the GW/MBH front, do post a comment.

2005-10-24

von S on the Hockey Stick

There has been a certain amount of argy-bargy between von Storch and MBH which has lead some people, I think, to mistake von S's position. A recent GRL paper goes some way to clarifying things. Read the RC post on this for refs, and the pdf etc.

As far as I can see, Von S and Zorita basically re-do the stuff from their Science paper, but trying the different centering techniques. And they discover... that it doesn't make much difference. I could have told them that (here though obviously I never quite finished it...). They say:

Our results, derived in the artificial world of an
extended historical climate simulation, indicate therefore
that the AHS does not have a significant impact but leads
only to very minor deviations.


All is, of course, not sweetness and light. There is more to come, I think.

2005-10-23

Gems from sci.env

Some gems from sci.environment. First, on the good-old global cooling stuff, someone (mynym) has managed to find some old newspaper cuttings that are relevant, all the way back to 1956! This is interesting, because its far earlier than previously suspected. But, its newspapers not science.

Elsewhen, someone who I will be kind enough not to name said:

> Momentum is not conserved in the same way as mass and energy.

And James "take no prisoners" Annan replied:


You just broke my...

+--------------------------------------------+
\ 1 2 3 4 5 6 7 8 9 /
\ 0 10 / /
\ / /
\ CRACKPOT METER / /
\ / /
\ / /
\___________________________/___/
\ /
\.........................../

2005-10-22

Your comment was denied for questionable content...

...so I'll post it here. The blog in question is RP Jr, the post this which he entitled "Tag Team Hit Job".

My comment was:

Roger, you complain too much. Curry says you say "Let's not worry about *why* we have climate change" and you don't defend yourself against that, but against something else.

and his software says... "Your comment was denied for questionable content. If you believe a legitimate comment was blocked, you may contact the administrator of this site. This site actively blocks or moderates messages with questionable content. If you feel your message is being blocked unfairly, please contact us. Moderated comments will generally be reviewed within 6 hours."

In fact I will contact him too, but I'm putting it here because (a) it was a good excuse for a post and (b) it illustrates the problems with fragmented conversations in the blogosphere. Mind you, RC also filters for content, but AFAIK doesn't tell you that you comment has been sent for moderation.

2005-10-19

Congratulations to Ross Chandler

This one won't mean a lot to most people.

For years, Coton village has had a slowly degrading pavillion barely adequate for cricket, football, etc. Various inconclusive repair/refurbish/rebuild plans were mooted, funders approached: nothing worked due to lack of drive, energy and ambition. A few years ago Ross got elected to the Parish council and has been doing his best to drive the project through, against a degree of conservatism (small C) and a decided lack of ability to take risks, even small ones.

Finally, tonight, he has what he needs: permission to rebuild the thing, demolishing the interior structure, and make a bonfire of the burnable bits. Which I think will make it inevitable that the whole thing will go ahead.

This, and my experience of trying to run an after school club despite the thicket of government regulations, is coming close to converting me to the values of entrepreneurship...

2005-10-18

Antarctic sea ice trends

After all the excitement about Arctic sea ice trends its time for that far more interesting region, the Antarctic.

I was going to write this the very next day, but had some odd results which took some time reconciling to reality. So this is using the Comiso (Bootstrap) data. Its also using extent, not area. And its 1979 to 2003, because the Bootstrap data at NSIDC is a bit behind the times (this is a good thing: it means its had extra QC checking for weather clearing and other stuff I don't understand).

So what does it look like? Oh, hold on... before I show you, read this:

The usual caveats apply. I've checked my pic a bit but I did this all in an hour at home tonight after spending some time worrying about Ofsted (and if you don't know what that means, consider yourself lucky), so if anything looks madly wrong to you, you may well be right.

So the pic looks like this:


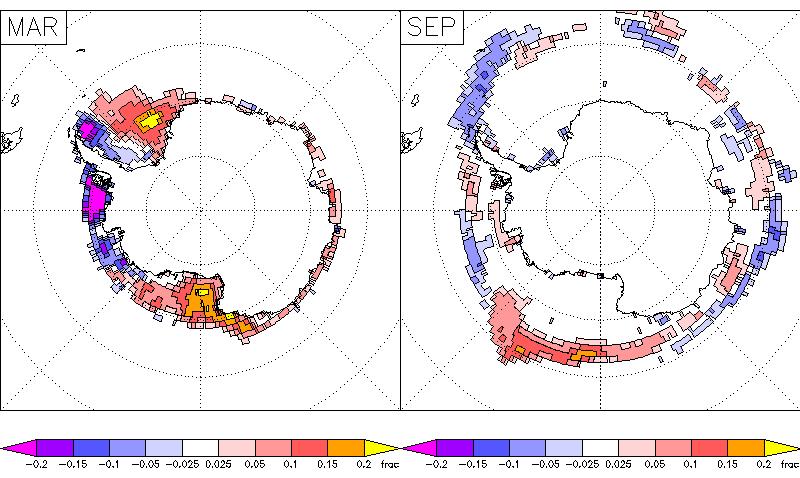
What you're seeing is decadal trends, by month. In the top pic they are expressed as a percentage of the average for that month; in the bottom, they are expressed as absolute (in millions of square kilometers).

I need to emphasise one important point, which is that the Antarctic ice cover has a very strong seasonal cycle. So the percentage figures can be a bit misleading. The biggest % change is in March (the ice minimum) at about 6%; but the biggest absolute change is about 300,000 km sq in May, with a % change of only 3%. This distinction exists for the Arctic too but is rather less important, because the seasonal cycle there is smaller.

Also, if you are looking at the previous post note that the data there is Team not Bootstrap and is area not extent.

In the Arctic (refer previous post), the main features are:


  1. Trends are always negative (ie, losing ice) all year round
  2. They are largest in late summer and autumn (I would naturally say summer, but september is autumn)


In the Antarctic, the main features are:

  1. Trends are mostly positive, but near zero and sometimes negative in spring/summer
  2. They are largest in (southern hemisphere) autumn (mar-apr-may)


In absolute terms, the largest (mar-apr-may) trends are about half the Arctic ones (reading off the nsidc press release). As to (statistical) significance... my software thinks that March and May are, but only just (95%).

And spatially they look like... in March and September (scale in fraction per decade):


Mixed.

And what (I hear you say) about the climate interpretation of this? Well (I answer) I didn't interpret the Arctic trends and no-one complained. Perhaps because it was all obvious to everyone. You may want to read the start of this old post too.

2005-10-17

The best of the last, the cleanest star they ever had

Or, the Best of Stoat. And in fact not even that, more a Categorised Stoat. Some things get into more than one category.
  1. Global warming: A primer on sources for global warming [2005/09/20]
  2. Temperature records: ...the increase in temperature in the 20th century is likely to have been the largest of any century during the past 1,000 years... [2005/10/12]
  3. Global cooling: Back to the ice ages: Ice, by Fred Hoyle [2005/09/23]
  4. Butterfly effect: Butterflies: notes for a post [2005/10] and Repeatability of GCMs [2005/10/04]; Junk science is junk [2005/09/26]
  5. Sea ice: Arctic sea ice trends [2005/09/28]
  6. Kyoto etc: Paper Tiger [2005/10/08]
  7. Septics: Why are we having a hearing that features a fiction writer as our key witness? [2005/09/28]; Junk science is junk [2005/09/26]
  8. Wikipedia: Rita Skeeter [2005/09/22]
  9. Misc: Pictures at an exhibition [2005/10/11]; My Office [2005/10/08]; Happy birthday to RealClimate [2005/10/03]; Welcome to RC readers [2005/09/28]; Killer sudoku [2005/09/28]; Misc stuff (reading; blogs; etc) [2005/09/27]; John Houghton caught blogging? [2005/09/24]; Technorati [2005/09/21]
[This is something that I wrote mostly for myself, but left in draft. Now (2017) for my own reasons I'd like it published, so will.]

2005-10-12

...the increase in temperature in the 20th century is likely to have been the largest of any century during the past 1,000 years...

The IPCC TAR SPM said:

New analyses of proxy data for the Northern Hemisphere indicate that the increase in temperature in the 20th century is likely to have been the largest of any century during the past 1,000 years. It is also likely that, in the Northern Hemisphere, the 1990s was the warmest decade and 1998 the warmest year (Figure 1b).

naturally, this was a red rag to the septics. Its was based, as it says, on Jones et al., 1998, Mann et al., 1998, 1999 and Briffa, 2000. How does this stack up, when compared against more recent reconstructions?

The answer is, extremely well. There is a nice pic on wikipedia (and I've inlined it above) which shows 10 different reconstructions. Looking at this pic we see that


  1. the increase in temperature in the 20th century is likely to have been the largest of any century during the past 1,000 years is true for all of them (and for those that go back further, it looks true of the previous 1000 years too)
  2. It is also likely that, in the Northern Hemisphere, the 1990s was the warmest decade is also true
  3. and 1998 the warmest year also true (it happens not to have been exceeded since 1998, and most likely not earlier)


Another interesting feature of those graphs is that they all pretty much agree on the temperature at the peak of the MWP as being about 0 on a scale that has "now" as about 0.4 (with the caveat of resolution). The major differences are on the depth of the LIA - about 1600, there is little agreement.

Which is why (you just knew I was coming to this didn't you) all the ho-ha over MBH98 is interesting statistically (perhaps) but irrelevant scientifically. It also ought to be irrelevant politically.

To debunk another couple of myths: idiots sometimes assert that the Hockey Stick (ie, MBH98/99) underpins Kyoto. This is nonsense for any number of reasons, but the most obvious is that Kyoto was negotiated in 1997 and you need to believe in reverse causality to think that a 1998 paper underpinned it.

Another one is pointed out by this RC post: The famous conclusion of the IPCC, “The balance of evidence suggests that there is a discernible human influence on global climate”, does not depend on any reconstruction for the past millennium. It depends on a detailed analysis of 20th Century data. In fact, this conclusion is from the 1995 IPCC report, and thus predates the existence of quantitative proxy reconstructions like the “hockey stick”.

Septics focus on MBH98 because they think they have something to say about it. People, naturally, respond. All this tends to give a rather unbalanced view of where the science is. The palaeo reconstructions are important, but only one strand. There is lots and lots of D+A (DAtDA?) that people tend not to discuss much, rather in the same way that few people discuss detailed solutions of GR much: its just too complex for anyone except specialists.


Note, BTW, that "likely" is defined thus: In this Summary for Policymakers and in the Technical Summary, the following words have been used where appropriate to indicate judgmental estimates of confidence: virtually certain (greater than 99% chance that a result is true); very likely (90-99% chance); likely (66-90% chance); medium likelihood (33-66% chance); unlikely (10-33% chance); very unlikely (1-10% chance); exceptionally unlikely (less than 1% chance). The reader is referred to individual chapters for more details.

2005-10-11

Pictures at an Exhibition

Sometimes I wonder if I focus a bit too much on this climate stuff... Another question is the intrinsic worth of things. And how to judge their relative value. Which in most cases is impossible.

I've been listening a lot to [[Sviatoslav Richter]] playing [[Picures at an Exhibition]] (specifically the recording in Sofia, 1958, if it matters). This is a wonderful recording which I can listen to again and again. The tone and depth of the piano is marvellous; it sounds far better and fuller than an orchestral version we have.

So how to you balance the relative life-worth of simply learning a pile of notes and how to play them in the right order, as against doing science? Who knows.

And now for our daily dose of climate: "I am not sure how clouds get formed. But the clouds know how to do it, and that is the important thing." (Chao mugger via PF).

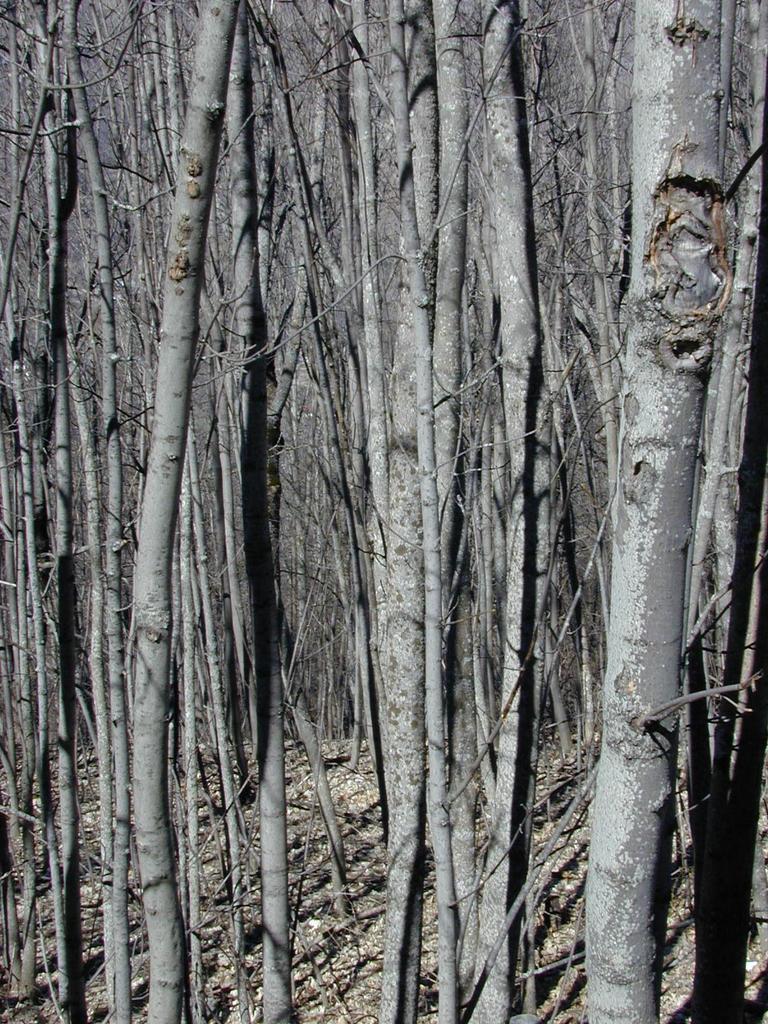
The picture has no particular relevance to the post, but I felt it needed one of some sort. Its a grey wood in winter, somewhat below Les Deux Alpes, in february 2002.

2005-10-08

My office

I know you must be wondering... what does the office of a famous climate modeller look like? Well, I can't tell you that, but I can show you a picture of mine.

Notice whats on the screen. Of course I'm not actually "in work" at this point.

I'm currently fighting a losing battle against getting the place redecorated and pointless modern plastic desks to replace the nice wooden desks (out of shot). There do seem to be limits to my powers.

On the window, you see one of my hobbies: collecting sugar paper wrappers. I hate restaurants which have sugar cubes in a bowl or those sugar shakers. No, I dont take sugar in my coffee. Also just visible behind my keyboard is the rubber chicken which lays an egg. Everyone finds it oh-so-tasteful.

A paper tiger!

The post title is stolen from John Quiggins post. And his post just about says it all: does this new agreement have any substance? Probably not.

So its time for - ta da - prediction time, since predictions made in advace are always more convincing. I predict: that JQ is right: the Asia-Pacific climate pact will turn out to be empty.

There's a wiki page [[Asia-Pacific Partnership for Clean Development and Climate]].

2005-10-04

Repeatability of GCMs

Somewhere in the discussion around and after a post of mine on Junkscience is junk I realised that people just don't understand repeatability in GCMs, or indeed much about them at all. This may be in part because they have assumed "telling us precisely which model you used, which initialisation files and what forcing values you supplied (so we can indulge that repeatability thing" (from http://www.junkscience.com/MSU_Temps/Model_Request.htm) made some kind of sense. Sadly now I can't find where the comments were, so I'll try to make it up.

So... although I'm fairly sure much of this is the same for most modern atmosphere-ocean GCMs, I'm actually talking specifically about [[HadCM3]].

There are two sorts of repeatability: you run the model again, and you get *exactly* the same results down to the last bit. This is call bit-reproducibility. Or, you run the model again, and you get *scientifically* the same result (the same climate; probably the same response to forcing within statistical error) but the exact details of the weather differ. Because the climate is chaotic (in the sense that small initial perturbations rapidly amplify) and GCMs reproduce this well, if your model diverges even slightly from bit-reproducibility it will diverge strongly from it, because the details of the individual weather will be totally different. But the climate (statistics of the weather) will be the same.

Which is a good time to point out that GCMs are really weather forecast models run at a lower resolution but for much longer. When you *see* GCM results you normally see global-mean annual-mean data. Don't be confused by this (as some clearly are) into thinking this is what the model directly outputs. It directly outputs temperatures at each gridpoint (96*73 in the case of hadam3 at std res; and in fact at 19 atmos levels too; and of course all the other model variables too) at each timestep (1/2 hour) and this is then meaned up into what you see.

For scientific purposes, bit-reproducibility is not necessary. The weather isn't supposed to be any individual events anyway, so you don't care if you get different weather. But for computational purposes, its rather useful. Firstly, if you're looking for the bug that caused a model crash, its pretty hard to find if the model isn't going to follow the same path when run again. Secondly, the model runs on multiple processors. Bit-reproducibility means it will follow exactly the same path even if the number of processors is different, or if the decomposition is 2*4 instead of 4*2. Also, a good test of the correctness of the MPP decomposition is to run it on different numbers of procs to check you get the same answer.

But bit-reproducibility is only possible on the same processor type, with the same compiler (probably the same version) and the same compiler options, and exactly the same code, and exactly the same input constants, and exactly the same start files, which are themselves enormous. And of course you have to be competent, which lets out Junkscience right from the start. In theory, from the papers and documentation you can write a version of HadCM3 that would be scientifically equivalent. You have no hope of writing one that is bit-equivalent. Its also possible to run the model in non-bit-reproducible mode if you want to (its slightly faster; for example, for bit-r you need to manage the corss-processor calculations in a particular way to get them to come out exactly the same).

And sometimes you don't want bit-reproducibility. The figure that JS are too stupid to see (SPM fig 4) has an ensemble of model runs deliberately started from different initial conditions so that the weather would be different in each, to get a feel for the range of natural variability. If you started a model (assumed to be 100% correct) back at 1860 with 99.9999% accurately known initial conditions you wouldn't expect it to track the individual years accurately (which is why those stupid sci-fi novels about time-travel, where they wander around being careful not to toouch anything, and only get into trouble when they accidentally crush a butterfly, are nonsense. Just being there, standing in the way of the air currents, is enough to totally change the weather and hence all of history). Hence to know if your model is right, you need an ensemble of runs to bracket the natural variability (and you may get unlucky and find that the real world took an unlikely branch).

2005-10-03

Happy Birthday to RealClimate

RealClimate just topped 500,000 visits (ha ha watch out Deltoid we're coming to get you...) and has received a Science & Technology Web Awards 2005 award. They don't say if they're in order or not, but in the list we're 9th (out of 25 I think). Chris Mooney makes it too.

Our post on it is here.

Meanwhile, less noticed, Stoat celebrated its 30,000 visit, and even more importantly my google ads racked up my tenth dollar! Only a factor of 10 to go and I'll get my first cheque.

2005-09-28

Arctic sea ice trends

A week or so I posted about Global warming 'past the point of no return' ?!? which commented on a rather over-excitable piece in the UK newspaper the Independent. I was a bit skeptical of the newspaper; now RP sr has a post too, and he quotes Mark Serreze saying:

In conclusion, Mr. Connor [the Indie journo] has “jumped the gun.” I am firmly convinced that at least part of what we are seeing in the Arctic is due to human influences. However, sensationalist articles like Mr. Connor’s only serve to further polarize what is already a very polarized issue... I feel “ambushed” by Mr. Connor’s article.
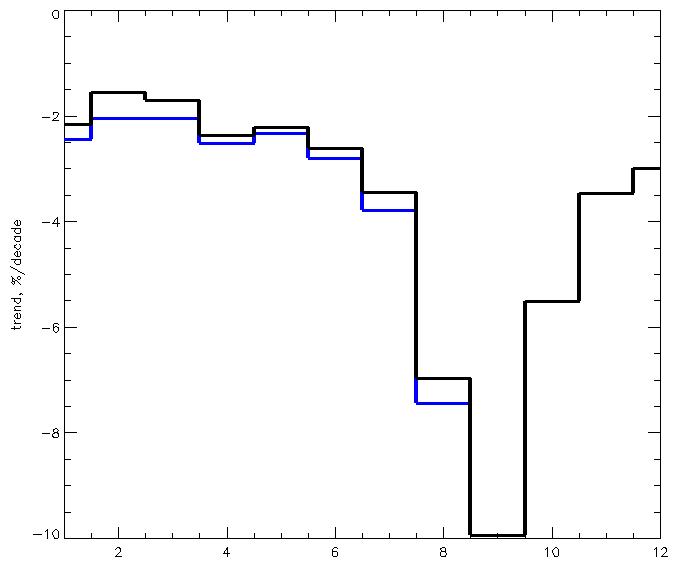

So... whats up? Firstly, RP Sr seems to like the UI seaice data, I don't know why. As SB points out in a comment here they were wrong a while ago when they disagreed with NSIDC. To introduce yet another source, I'm going to use the NCEP product for this post (because its easily available; probably the answer to my RP question above is that the UI product is easily available for his purposes), though (as I pointed out here) I actually prefer the Bootstrap to the NASA Team product, at least for the Antarctic. also (for fans of important-but-boring detail) I'm going to use total area for my trends, not extent. Its all different ways of processing the same [[SSMI/SSMR]] dataset, anyway.

NSIDC has a press release out Sea Ice Decline Intensifies Summer Arctic sea ice falls far below average for fourth year, winter ice sees sharp decline, spring melt starts earlier which has some nice pics in it and some useful discussion by scientists (I'm doubtful about "The persistence of near-record low extents leads the group to conclude that Arctic sea ice is likely on an accelerating, long-term decline" early in the piece, I suspect that was put in by the PR folks. Its not really supported by the graph just next to it, which shows 2005 as low, but not really far below the trend line. Having said that, if their fig 2 is correct, the ice does seem to be unusually late recovering this year). Why they felt the need to put it out today, rather than waiting a few more days until the end of september, I don't know. Anyway, sea ice doesn't change that much over a few days so their pic is probably going to be correct at the end of the month. RP says that NSIDC haven't made sept available: but the NCEP GRIB is available in realtime from ftp://polar.ncep.noaa.gov/pub/cdas/ for anyone with the patience to convert it (you want wgrib, if you want to convert it, which you don't want to do...).

So *my* contribution to this is the piccy here, which shows sea ice area trends (% per decade) from the NSIDC (thank you Bob) dataset from 1979-2004 (black) and -2005 (blue) up to august. Because in all this the fact that the trends are quite seasonal is being missed a bit. Note that my trend for september is about 10%; NSIDC say about 7-8% depending exactly on which year you stop. The difference is probably due to me using area rather than extent (a quick test says that switching to extent reduces my trend by about a factor of 1.4).
Oh... and the usual caveats apply. I've checked my pic a bit but I did this all in an hour at home tonight, so if anything looks madly wrong to you, you may well be right.

[Update: and the *other* thing I was going to say which I forgot was... this is all pretty well in line with the model results, as far as I can remember them. I'm thinking of Recent and future changes in Arctic sea ice simulated by the HadCM3 AOGCM by Gregory, J. M.; Stott, P. A.; Cresswell, D. J.; Rayner, N. A.; Gordon, C.; Sexton, D. M. H. So the attribution of the trend to GW seems reasonable.]

Why are we having a hearing that features a fiction writer as our key witness?

The headline for this post is the rather plaintive quote from minority leader senator Jeffords' statement at the US Senate EPW committee hearings today. The fiction author is the egregious Crichton.

This question is a reasonable one. The answer is obvious: that Inhofe has totally lost the plot. The details however remain to be seen.

There doesn't seem to be much else available yet, but I'll update this when there is.

Note that this is the Inhofe hearings, not the Barton hearings, which seem to have been wimped out of for the moment.

[Update: there is now an RC post on this with some more detail. Wonkette and Think Progress also take the piss. Note that we need to be careful: Crichton deserves dishonour and (slightly contradictarily) contempt (I like Hobbes and his definitions). The point at issue is not C's worthless opinions, but the apparent waywardness of a (presumably) powerful US senate committee.]

Welcome to RC readers...

A welcome to any RealClimate readers who have follwed the new link across... my humble personal blog having been deemed link-worthy at last!

Perhaps this is a good time to re-state the blogs purpose. Mostly, its for climate science type things, though generally at a lower level of detail and quality than RC aims for. However this may lead to a slightly faster response time and I also comment on things "beneath" (or too personal) for RC. And then of course theres the odd bit of politics or misc.

Don't forget to check out my blogroll on the banner...

Some highlights from the past


I'm in the process of constructing a whole "guide to stoat" (as a precursor to doing the same for RC), but in the meantime a few bits and bobs that I shall call highlights, mostly in reverse time order:


  1. Junkscience is junk - no surprises there
  2. A primer on GW sources also check the comments
  3. Soil carbon losses
  4. Not betting on Climate - anyone prepared to put their money where their mouth is? (Rumour that Gray has just said he will... could be interesting)
  5. More myths of the near future
  6. Ask Stoat - any questions...?


Meanwhile, radio4 news had a prominent item (including piece from Todd Arbetter, just appointed at BAS!) about the low sea ice this summer. Hmmm, must check up: is this reality or the over-efficient NASA PR machine? [The bbc r4 link is: http://news.bbc.co.uk/1/hi/sci/tech/4290340.stm]

Killer Sudoku

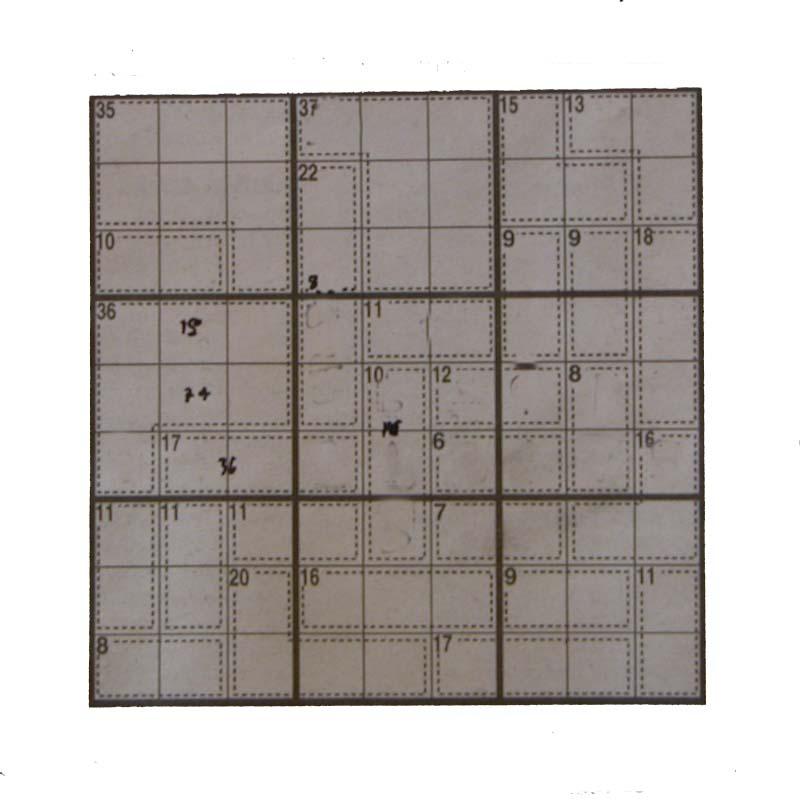
There is a new and interesting sudoku variant, the so-called "killer", in which you get no starting clues at all but you get to know the sums of certain boxes. Like this:


So far, its only available in the Times. If you want a hint on how to start, then: the sum of each 3x3 must be 45 (1+2+...9). So the middle-left box has a 36 and a 17 (sum = 53) with one box hanging out of the 3x3. Hence that one box must be an 8 (53-45). I'll leave you the rest, the guide time was 28 mins but I think thats a bit optimistic unless you're very good.

2005-09-27

Misc stuff

One of those tedious posts listing things the author has been reading recently. This is in part because I was going to write some politics stuff and discovered other people have said it all anyway... BTW, I find I had 22 tabs open to write all this, is that a record? Whats your maximum?

News just now is that Quark Soup has gone, somewhat earlier than promised. Space for a brief muse there perhaps... it was the first blog I read; perhaps DA somewhat lost his place when other climate-type blogs (RC mainly; perhaps even Stoat) took some of his niche. Deltoid was the next one I read... I trust they won't be going out in order.

So... capitalistimperialistpig (who I owe a response on energy balance... its coming... in the meantime, this) condems the US Policy of Torture. We don't do torture ourselves (at least not in public) but why do we need the Law Lords to decide should evidence extracted by torture abroad be admissible in the British courts? rather than the more obvious just-say-no. I'm wondering if terrorism is the new paedophilia is the new witchcraft... Mikael Hallendal finds a story about someone getting arrested in the London subway [ahem... underground] for no good reason, but you've read that through Planet Fleck already. Guantanamo is weird too but that piece is a slightly different slant.

Just like everyone else I read "Don't get stuck on stupid" though I seem to have taken a different moral from it than everyone else.

Meanwhile, over at Creek Running North, I discover the concept of Lurker Day (via, I think, John Quiggin). So, lurkers here, treat this as an invitation to say hello...

Dead trees: I'm reading A War against Truth - An Intimate Account of the Invasion of Iraq by Paul William Roberts. I was lent it. So far I'm up to p73 and I have to say that while its interesting, its a little bit too much yes-yes-I-agree-with-that sort of stuff. And... its a bit too passionate, so I'm not sure all of it can quite be trusted.

For wacko science, I followed [[Zbigniew Jaworowski]] to http://www.21stcenturysciencetech.com/Articles%202004/Winter2003-4/global_warming.pdf. He is, ostensibly, predicting cooling... so he should be up for a bet, yes? Ho ho. Speaking of wiki, Jimmy Wales has a blog but it doesn't get updated much.

Wacko maths is also available (no, not string theory (ho ho)) via the talk page of [[Cantor's diagonal argument]]. In some ways this is comforting: I spend a lot of time arguing with wacko GW septics, but at least in that case there is no definite mathematical proof. In the Cantor case, there really *is* definite proof, but the wackos still can't cope with it. Side note: check out the article itself, which points out (did you know this? I didn't) that "the diagonal argument was not Cantor's first proof of the uncountability of the real numbers, but was published three years after his first proof."

No space for this today, so I'll put a placeholder for we-are-rich-but-full-of-sh*t, by which I mean it seems that the amount of total twaddle (and I mean meaningless bureacracy, not GW wackos) generated by a society is related to its wealth. The richer you are the more parasites you can afford. Which, looking forward, is bad news.

Via CIP, I found "ecosystems" and discovered I am a Slithering Reptile (CIP is only a Flippery Fish :-).

2005-09-26

Junkscience is... junk

Well, you all knew that anyway I suppose, but what I didn't realise until just taking a look recently was quite how appallingly bad it is. At http://www.junkscience.com/MSU_Temps/Model_Request.htm they ask "if anyone has managed to recreate say, Earth's global mean temperature track for the period 1880-2000 (we'd accept 1880-1979 or some reasonable facsimile) as GCM output". Errrm, well, yes, you can try reading the TAR. Figure 12.7c: http://www.grida.no/climate/ipcc_tar/wg1/450.htm#fig127 has a nice picture (it even goes back to 1860), for example, and refers you to the appropriate papers. Note that the JS quote fails to say exactly what measure they mean, but later down they say "annual mean temperature track" so presumably they do mean annual mean. But if so, why do they then say "any track that manages to stay within ±1.5 °C..." when, as the TAR pic makes clear, thats far too generous an error margin.

So, I admit, I'm baffled. Have the septics really lied to themselves so often that they have come to believe it? I suppose so.

[Update: if you're mad enough to look at http://www.junkscience.com/MSU_Temps/Warming_Glance.htm you'll find the UAH data plotted, with the excuse that they don't plot RSS because "RSS do not publish Lower Troposphere MSU data". But this is false. The data is available from Rss's ftp site and you'll find it ref'd at a page rather more respectable than JunkSci: [[Image:Satellite_Temperatures.png]]. I've mailed them this, we'll see if they upgrade.]