 Beginning with rain. Because, when I was packing, it was a nice day, I didn't bring a rain hat or umbrella. Remember, folks, the past and present are not necessarily a good guide to the future.
EPICA session: starts off with Berger: origin of 100kyr cycle: maths. As he says, the full sets of periodicities for the various elements of ecccentricity, obliquity, etc are rather complex, and he reports on often getting annoyed by the over simplifications some papers present. Nice pictures of wavelet analysis of the various components, showing how the eccentricity has been shifting from 100kyr in the past towards 400kyr in the future (yet another reason not to take the future predictions of an immenent ice age seriously: again, the future is not necessarily like the past).
Quick run round and downstairs to: global dimming or brightening? (Lohmann) From ISCCP rather than ground (not quite clear how this is done); since 1983; more brightening than dimming; BUT clear artefacts in the data showing the edges of the satellite field-of-view. So the results are hard to interpret. But brightening is consistent with Wild since the start of the 90's. If you can trust the satellite data, then Australia is an island of mild dimming in an ocean of brightening; so the few ground measurements may not be typical. If (again) you believe the satellite data then the trends are due to cloud trends (which I suppose is obvious, given that this all starts from ISCCP data). OTOH that was all for direct radiation; the total (inc diffuse?) shows far smaller variations (which would explain the lack of climate effect).
Eric Wolff: very interesting talk (as representative of the EPICA chemistry team) about chemistry from ice cores (disclaimer: he is a colleague of mine). He had a few controversial things to say. That MSA glacial/interglacial changes (at least at low-accumulation sites) is dominated by post-depositional effects. So that the "conventional" interpretation of MSA is completely wrong. Proceeding, he convinces us that the Sodium (non-sea-salt fraction?) is a proxy for sea ice (frost flowers), and then shows that there is a near-linear relationship between sea ice extent and temperature over the last 800kyr (with no break at the 440kyr point, where the cycles change their nature: the interglacials before then are cooler and longer, so the overall cycle is smaller). Using the sulphate (not the MSA) signal, he finds it near constant (in complete constrast to MSA), hence that marine biogenic production was near constant, which may have some implications for CO2 drawndown and stuff.
Ganopolski: CLIMBER model. How well it does for the past; spectrum matches SPECMAP well for past 800kyr. But it doesn't fit the volume before 400kyr, because it assumes compete deglaciation, which didn't happen before the last 4 cycles. So he stuffs in a 15% floor before 400kyr and gets a better match. This model predicts a 50kyr long "natural" holocene (so MIS 11 400 kyr ago, which was 23kyr long, is not a good natural analogue for now; instead, he predicts that the "natural" now would be an analogue for the stage about 400kyr in the future). But as he notes, anthro CO2 will impact this. Using Archer (2005) CO2, of 5000 Gt CO2 (C?) emitted now, which lasts for a *long* time (goes up to 1000 ppm; doesn't recover below 400 ppm out for 400kyr), which wipes out the glacial cycles for the next 400kyr. Mysak has much the same results.
Coffee break: no coffee :-( no water :-(((. Is this really Vienna?
More EPICA. Zeng looks at carbon fluxes, and what happened to the high latitude forests during the last ice age. the conventional picture (apparently) is that this veg gets swept away during an ice age and the carbon ends up in the atmos, which means that the ocean needs to draw down even more, since CO2 does down during ice ages. He proposes, instead, that it gets buried under the ice. This is an interesting question, though for all I know well discussed already. Would there be remains to see? Perhaps.
Siegenthaler gets to show the long-awaited EPICA CO2 record. The O18 record has been around for a whie (published in Nature) but CO2 takes longer: pics of the "cracker" (which crushes the ice: reproducibility 2.5 ppm) and the "sublimator" which is more efficient but slower: 2 samples/day. It is important not to let the ice get wet in the process. So: the "EPICA challenge" was to predict the CO2, given the O18 (and anything else you liked). The O18 shows lower cycles before 440kyr; it turns out that the CO2 pretty well follows the O18: smaller amplitude cycles and lower interglacial values. But they don't say who won the challenge :-). The CO2-ice age offset varies from 2-6 kyr (I presume by modelling / acc rate) and the CO2 lag to T is 1-2kyr, ish, based on matching some key events, though with one +ve lag.
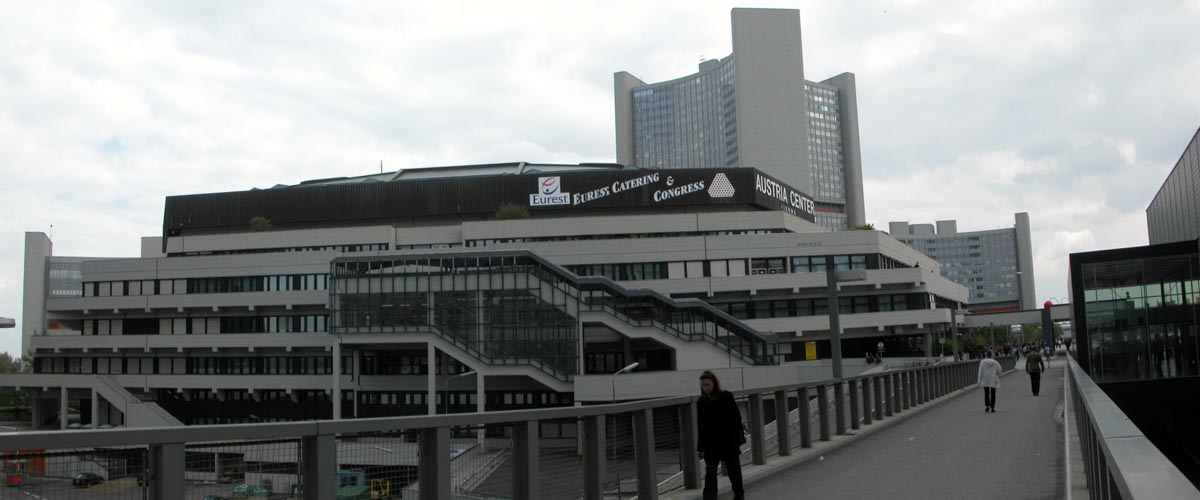
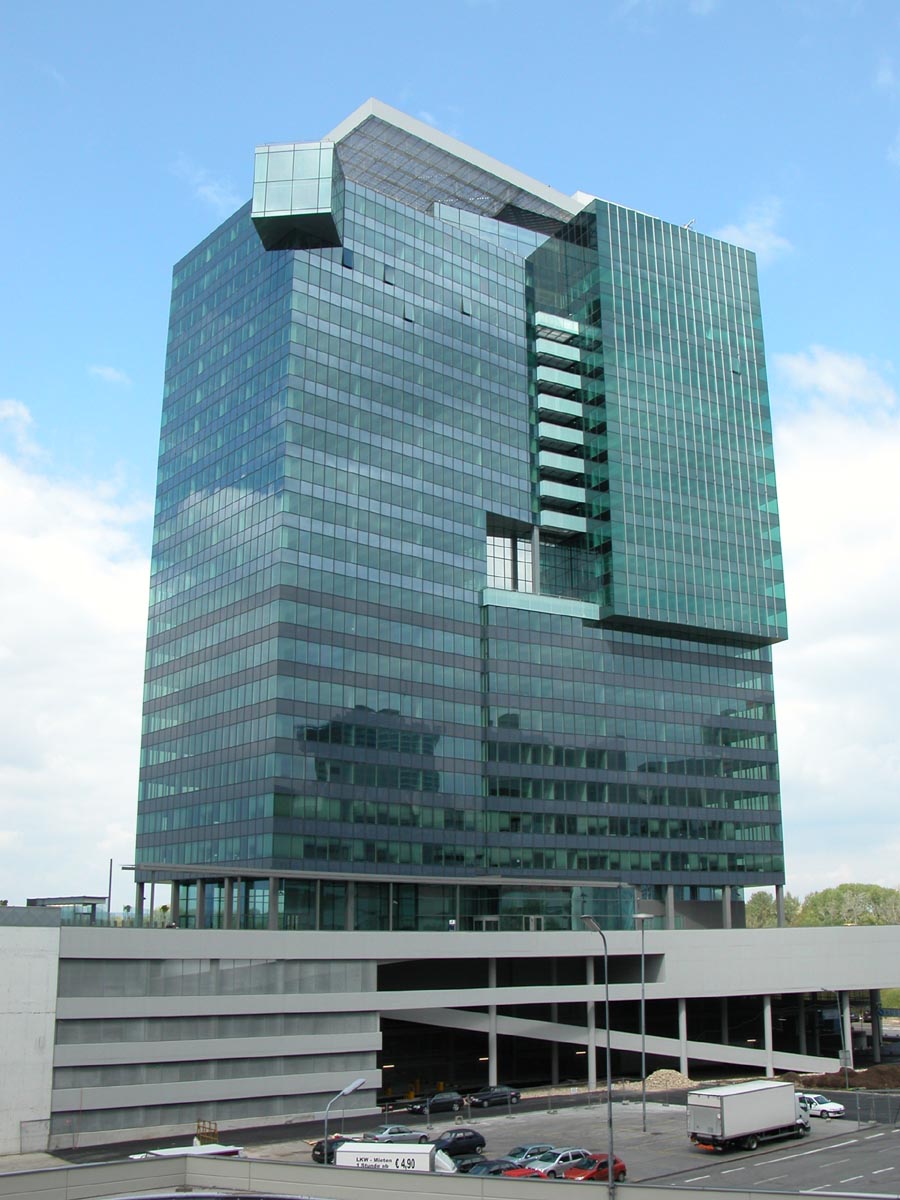 Lunch: giving up on the Qs go to the ubahn and a nice backerei; then walk down by the river. The conference centre is in a block of huge glass-steel-concrete buildings on the far side of the Neu Danube from the main city. The biggest (and to my tastes the best) is "UNO city". The conf center is probably the ugliest, a squat concrete object with a generic resemblace to the Acropolis (in Nice, *not* the one in Athens...). There is an interesting "cube" building which has a projecting glass cube near the top that gives the illusion of floating in front of the building. However, the entire grouping lacks human scale: you walk vast windy inhuman alleys between monsters. Though at least the grouping of the buildings allows for nice parks all around.
After lunch: more misc things; the EPICA Dronning Maud Land core (EDML) matched to Dome C (EDML is not on a dome hence the ice flow modelling is harder (indeed they seem to be aging it by matching to EDC) and the core shorter (in time)). But, it gets influences from a different sea and the comparison is therefore interesting, allowing people to deduce that dust transport doesn't change much but sources (Patagonia) do. Interesting factoid: the 41kyr obliquity signal is missing in EDC before 440kyr.
Poster time: standing in front of the Hadley+me Hadgem-sea-ice poster. Time to look round first: misc: Kaspar and Cubasch: 115 and 125 kyr sims with ECHO-G run for 3000 years! Finding that insol variations *are* enough to explain the T response and to show a long term cooling at 115 kyr: this explained by feedbacks from growing snow cover. This is more like it...
Talking with TJ re the "1860 control" question. HadGEM (and CM3, and indeed most/all coupled GCMs) are spun up to "pre industrial" conditions nominally 1860. Most of the reason for this is that you want to start your transient runs from then to avoid a cold sart problem. But, it means you control run is not really for modern conditions but a colder world. Which affects, eg, your validation of the sea ice. By an unknown amount.
GRACE: continental water storage and the 2003 drought. If you look at the estimsates of sea level rise and the various contributions, continental water storage is one of the major uncertainties. Apparently you can use the GRACE gravitational measurements to look at the year to year variations of water storage, which is interesting. Something like 8 cm (locally) for the 2003 drought.
Eric Steig: siple/byrd/taylor dome ice cores and cross comparisons to GISP. Looking at the coherence and phase at various frequencies shows good coherence up to about 1-2 kyr periods, and then little past then. Which he interprets to mean that the timescales are not synchronised to better than that. There is a 20kyr Rapid Warming in the siple core not seen elsewhere. There is a "feature" at 15kyr in the taylor core which he is coming round to interpreting as a snow hiatus (either, no snowfall or it gets scoured off, resulting in the loss of an unknown length of the core. Which could mean re-interpreting some of its matches to the other cores. All of this is "only" the last 100kyr)
8 comments:
William:
Thanks for these blogs on the EGU. Since I am only an amature climate watcher (and not a wealthy one at that) I can't attend but these are really interesting glimpses into the "cuting edge".
Great work.
John Cross
Thanks for the thanks. I know people read this (cos I see the access counts) but I never know what you think unless you comment...
Thanks Peter. You shouldn't understand all of it (well, you'd be doing pretty well if you did) but do feel free to ask for clarification of anything particularly obscure but interesting-looking :-)
I think you've understood correctly. As far as I can judge it, the issue is that von S et al may well have used an over-large solar forcing in their runs, so causing over large variations, which would have obvious implications for the MBH/Moberg/etc question.
There is apparently (I can't remember seeing it) a side comment in the von S Science paper that "the hadley model gets similar results" and you have to look at the online supplementary info; someone was complaining that when you do look, the hadley version isn't really similar at all.
Hey W, I was glad to get spotlighted for my EGU talk.
FYI some might get picky about the term "GISP" as it is actually GISP2. GISP was the original, largely European Dye2, Dye3 drilling projects. We Americans took the name and added a 2!
Eric
Eric - I can never keep these things straight. I think they are mostly straightened out at wikipedia: GISP, GRIP and but feel free to add your rather more expertise to them.
Oh do I had the comment software at blogger, I'm wondering about switching to wordpress if I can. Anyway, that last link should say "and ice core", and if you click it, thats where you go.
I am concerned with the climatology claim that temperature leads CO2, and that CO2 does not raise global temeprature. This is supposed to be backed up by ice core evidence. I am wondering what the evidence that CO2 warms climate actually is. I am a scientist, but not a climatologist. Also, would diminishing rates of plankton in the sea influence CO2 levels?
Post a Comment