The starting point is Timing of abrupt climate change: A precise clock by Stefan Rahmstorf (GRL, 2003), and also recent RC: chaos and climate (check the comments). When I first read the GRL paper I somewhat distrusted it. I'm not sure why. The basic idea of that paper is that the [[Dansgaard-Oeschger events]], which occur with approximately 1,500 year spacings in the last glacial, really are regularly spaced, albeit with occaisional "misses". This somewhat overturns what I thought was the conventional wisdom, which is that the D-O events are responses to the Laurentide ice sheet internal instabilities, or somesuch, and if so would only be quasi-periodic.
One problem with that view is that if they *are* truly on a clock, then that probably requires an astronomical clock, nothing on earth being regular enough. In todays Nature Braun et al (inc Rahmstorf) propose a Possible solar origin of the 1,470-year glacial climate cycle demonstrated in a coupled model which they get from combinations of the De Vries (210) and Gleissberg (86.5) cycles. I only mention that to draw it to your attention; I have no opinion as yet.
 You only get the nice 1,470 spacing if you use the GISP core, and only for the first 50 kyr of it. Which is maybe why I was suspicious... it smacked of choosing your data carefully. But now, having overplotted this stuff a few times, I've come to appreciate that the GISP and GRIP timescales aren't the same. And (so it is claimed) the layer counting for the first 50 kyr of GISP makes it most accurate. Quite likely.
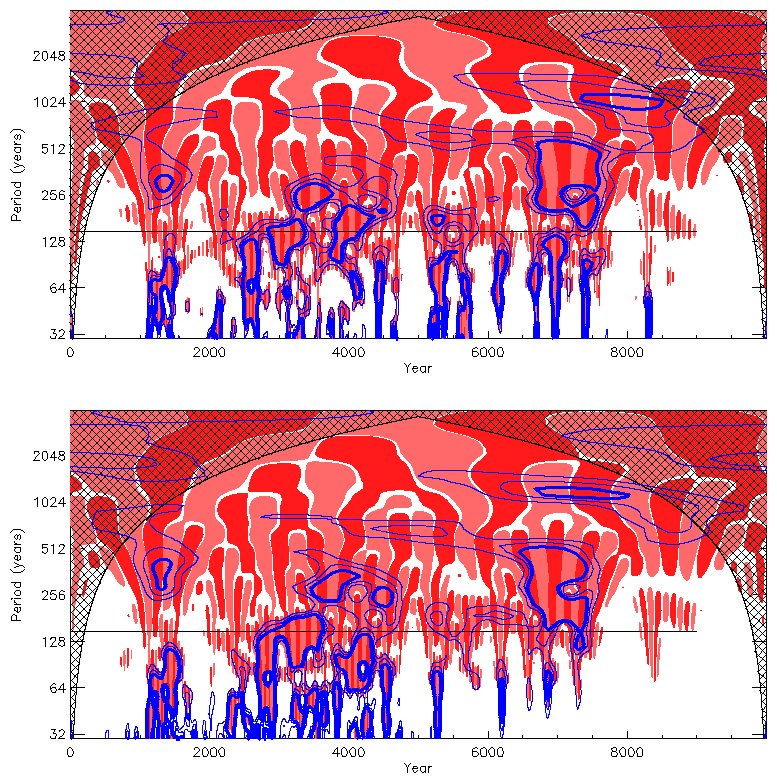
My own little contribution is the plot here. Sorry about the garish colours. Its a [[wavelet]] decomposition of the same delta-O-18 data. To do that I had to regrid the data onto a regular 10 year time grid, which is why that plot is lying about the timescale: for "year" read "decade". One plot is GISP. The other is GRIP. I forget which: if you really know your data you can discover which is which. Your clue, if you need one, is to look near the 40 kyr date. However, on this plot at least, GRIP and GISP look fairly similar. My own view is that on this view, the data looks quite noisy.
Errm, and thats it for now. Sorry there's no conclusion!
1 comment:
The digits on your timer scale should have an additional 0 (0 to 100.000)
Post a Comment