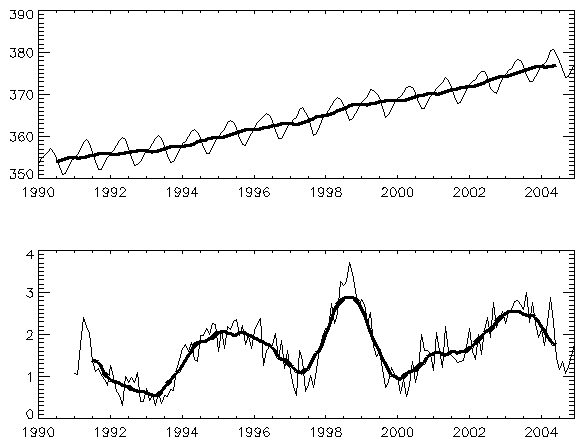
 The graph shows recent CO2 changes. Top are the CO2 themselves (monthly, plus 13-month running mean); bottom are change-on-12-months earlier. Data from Mauna Loa; sadly I can only find them up to end 2004. Which means I can't provide a decent answer to SB, who asked about reports that this years CO2 rise was 2.2 ppmv. However, even if it was 2.2 (can anyone find a report, or better still the data?), that looks to be nothing surprising, in view of the past. And its clearly lower than the 1%/y assumed by some of the idealised scenarios. When I find the SRES data I want to look at how the various scenarios look around now.
I find it hard to get too excited about the exact levels for any one year; what matters are the long term trends; for the future, those are clearly Upwards, but by how much depends on economics that are rather tricky to forecast. But T rise (etc) can largely be scaled to CO2 level, rather than date. James Annan (ref lost) pointed out that methane levels seem to be well below SRES trends (indeed this shows them to be currently flat; whether that will continue I don't know).
Meanwhile, JF has a post sort-of about this too, with a vigorous exchange of comments.
[Update: And John Quiggin has a post too. Pure co-incidence... he too appears to be on the it-does-make-much-difference idea, but with the advantage of understanding the economics]
5 comments:
Looks as if the curve is starting to flatten out. CO2 can't keep rising in a biological system, because of feedback.
The warmer ocean temperature and higher CO2 level will creat more hard-shelled sealife, which will precipitate more carbon in shells, CaCO3.
I think this is vital to climatic change, and is sensitive to marine biology. Perhaps I'm just ignorant, I think the major source of data on how much CO2 the oceans take up is from crude measurements of the fate of carbon-14 from nuclear tests in the atmosphere. That data was inferred from the fall in atmospheric carbon-14 levels, but they probably guessed how much ended up in the ocean as compared to wood in rainforests.
To predict global warming you need to get your wellies on and survey the average growth rate of wood in different forests and marine shellfish better, satellite photos and mathematical models are fine for weather prediction, but where is the carbon dioxide going to end up? In wood and shellfish.
>Looks as if the curve is starting to flatten out.
Here is a longer term graph I did about 6 months ago:
Graph
If 3 out of the last 4 years are over 2 and only 3 of the previous 39 years are over 2, is the curve beginning to flatten out?
I wouldn't even like to comment on whether the rate of rate of growth is beginning to flatten out without someone telling me why there is such a large dip in the rate of growth between 1988 and 1996.
crandles
Chris - thanks for the longer term graph. Let me know when you find 2005 CO2!
Nigel: biological feedbacks are an interesting question, and potentially complex. However your certainty that they will be one-way is wrong; they could just as easily increase CO2 (Amazon forest die-back being one obvious possible). There is also the CO2-less-soluble-in-warmer-water problem.
>Let me know when you find 2005 CO2!
BBC News
crandles
Before it disappears, an excerpt from (and recommendation to read while it's there) the BBC story. (Does anyone have a primary source to the Colorado study this is based on?)
Last Updated: Tuesday, 14 March 2006, 00:12 GMT
E-mail this to a friend Printable version
Sharp rise in CO2 levels recorded
By David Shukman
BBC science correspondent
Rocky mountains in Colorado
Air samples have been taken from Colorado's Rocky Mountains
US climate scientists have recorded a significant rise in the concentration of carbon dioxide in the atmosphere, pushing it to a new record level.
BBC News has learned the latest data shows CO2 levels now stand at 381 parts per million (ppm) - 100ppm above the pre-industrial average.
The research indicates that 2005 saw one of the largest increases on record - a rise of 2.6ppm. ....
Post a Comment