 Rapid decline of Arctic sea ice volume: Causes and consequences by Jean-Claude Gascard, Jinlun Zhang and Mehrad Rafizadeh in The Cryosphere Discussions, https://doi.org/10.5194/tc-2019-2. Doubtless containing much fascinating science, but the only bit anyone cares about is “it should take no more than 12 to 15 years to melt away the remaining 25% of sea ice still resisting the summer melt”. But where does this prediction come from? From Based on a steady loss of -300km3 of sea ice per year and a Pan Arctic sea ice volume minimum estimated to be about 4000 km3 at the end of the summer by now, it should take no more than 12 to 15 years to melt away the remaining 25% of sea ice still resisting the summer melt. Thus, just curve - on in this case, straight-line - fitting; no physics. So this is just a re-run of the Maslowski stuff, though the last time we discussed that, I found I hadn't a clue about what Big M had actually "predicted".
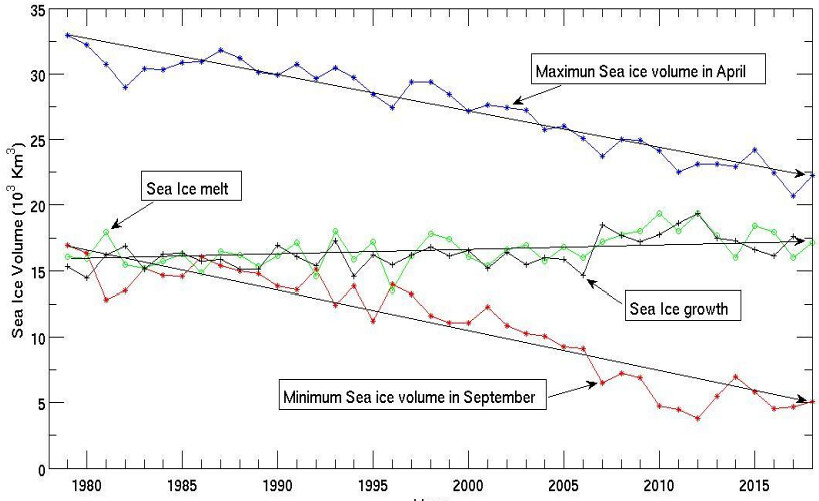
In case you've forgotten, I inline what they think the volume trends look like. I'm doubtful their prediction will come true. Why would I think that, other than to be curmudgeonly? I'm not expressing any great faith in the CMIP5 models, which predict something later. No, it's more of a feeling that volume doesn't respond linearly, especially when the ice gets thin (see-also their figure 8, though that's for May; it's a shame they don't show it for September too). I could be wrong, of course. Sadly 12-15 years is too far away for any kind of useful bet.
Refs
* Dosbat also sees the light, from 2015.
7 comments:
I'm not sanguine on this one, because of my preoccupation with water albedo.
There are many sides to Arctic amplification of radiative forcing . One is that the patchier the ice cover, the more low angle sunlght ends up in the water- swiss cheese melts down more readily than cheddar.
Neven's Arctic sea ice blog looks a little more optimistic, although Neven himself is not. As does https://sunshinehours.net/.
Kinda seems like, for the moment, arctic ice has settled into a new regime.
> water albedo
Maybe. But even a thin cover of ice makes quite a difference.
> Neven
I looked for some comment on this, there, and didn't find any. When you say "optimistic" do you mean, for the prediction, or for the life of the sea ice?
Last poll on topic at Neven's
https://forum.arctic-sea-ice.net/index.php/topic,2348.0.html
When will the Arctic Extent dip below 1,000,000 Km^2
2018-2019 12 (17.9%)
2020-2025 21 (31.3%)
2026-2030 13 (19.4%)
2031-2040 15 (22.4%)
2041-2060 2 (3%)
2061-2080 0 (0%)
2081-2099 1 (1.5%)
2100-beyond 3 (4.5%)
or maybe volume poll
When will be the first year that daily ice volume per PIOMAS goes below 1000 km^3?
2018 10 (8.5%)
2019-2021 20 (16.9%)
2022-2024 32 (27.1%)
2025-2028 30 (25.4%)
2029-2033 15 (12.7%)
2034-2039 3 (2.5%)
2040-2049 2 (1.7%)
2050-2059 1 (0.8%)
2060 or later 5 (4.2%)
Perhaps community is giving a little more credence to 2030 and later dates more recently but still looks rather alarmist to me.
Given they say (lines 485/6)
"The cumulative FDD sea ice thickness-based estimations revealed a quasi disappearance of the MYI for 2018"
I agree, it does seem somewhat strange that they don't seem to consider possibility of gompertz shaped curve as a possible alternative to straight line decline.
(like
https://forum.arctic-sea-ice.net/index.php?action=dlattach;topic=2288.0;attach=98947;image )
> looks rather alarmist
Possibly some selection bias in those who take part.
> like
Yes, more like that.
If you like fig 8 from FDD calculations, you might also like some of Chris Reynolds graphs of PIOMAS data like
http://1.bp.blogspot.com/-GAv0JbajhaE/VWbBQ-NAnxI/AAAAAAAAB_s/n-2eI7ScHGs/s1600/Arrctic%2BOcean%2BWall.png
from
http://dosbat.blogspot.com/2015/05/the-slow-transition.html
Haven't found similar one for Sept PIOMAS data, but PIOMAS data is available if you want to do it yourself. I am inclined to think that how the maximum changes gives good clues about what is likely to happen.
Get rid of thick multiyear ice(MYI) and it does not come back. Melt thin FYI and it bounces back each winter. So the disappearance of MYI can be a fast rate of decline and when thick MYI is all but gone you are back to a slow rate of decline.
(At first this sounds kinda weird because if the MYI is all gone, there should be ice free conditions at the minimum. However, there can also be thin MYI where thickness bounces back each winter.)
And, this seems to be showing up in the data. That ought to be close to game over for the arctic ice alarmists but perhaps unsurprisingly they are not keen to embrace it, or at least not very quickly.
Post a Comment