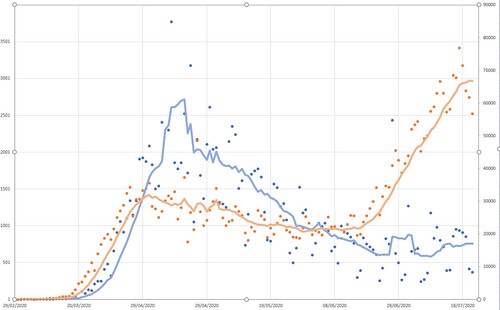
 Mandlestam, of course. But it isn't quite working out like that. My graph shows a puzzle: in orange, right axis, the USA new cases. In blue, right axis, new stiffs. Both with Excel's finest 7-point smoothing applied, without which you see a distinct weekly cycle.
When the case numbers started going up - quite a while ago now - you could fairly hear the slavering in some quarters. But the deaths - whilst higher than we'd like - are resolutely refusing to skyrocket1. And even the new cases seems to be slowing somewhat. Before you splutter with outrage into your cornflakes, I'm not claiming this is a glorious success.
Explanations for the odd failure of deaths to increase vary. If you're Trump, you'll laud the increase in testing. There was some weak evidence I saw suggesting more Yoof were getting it, and they don't tend to die. And maybe the sawbones have worked out how to keep it from killing people.
The Russia Report
Meanwhile in the UK the Russia Report turned out to be rather dull. In other news, the US maintains a chain of radio stations intended to influence behaviour. The best they could do was The British government and intelligence agencies failed to conduct any proper assessment of Kremlin attempts to interfere with the 2016 Brexit referendum, which does seem rather careless. OTOH, comparisons with the Dem leaks seems foolish: we didn't find out about those due to the spooks, we found out because they were published. And all this is the product of 18 months’ work involving evidence taken from the UK’s spy agencies and independent experts - how you can take that long to draw such negligible conclusions is hard to understand, unless you're on per diem. Disclaimer: I haven't read the actual report. Has anyone else bothered to, and if so, does it say anything interesting? James has his own conclusions.
Jem Bendell is an idiot
ATTP has belatedly discovered that Jem Bendell is an idiot.
Notes
1. I do hope this post doesn't jinx them.
Reading the report
I found the report (thx Graun) and am obliged to say that they get the Commies spot-on in their intro:
The security threat posed by Russia is difficult for the West to manage as, in our view and that of many others, it appears fundamentally nihilistic. Russia seems to see foreign policy as a zero-sum game: any actions it can take which damage the West are fundamentally good for Russia. It is also seemingly fed by paranoia, believing that Western institutions such as NATO and the EU have a far more aggressive posture towards it than they do in reality. There is also a sense that Russia believes that an undemocratic ‘might is right’ world order plays to its strengths, which leads it to seek to undermine the Rules Based International Order – whilst nonetheless benefitting from its membership of international political and economic institutions. Russia’s substantive aims, however, are relatively limited: it wishes to be seen as a resurgent ‘great power’ – in particular, dominating the countries of the former USSR – and to ensure that the privileged position of its leadership clique is not damaged.I don't care for The clearest requirement for immediate action is for new legislation, because yet more bloody legislation is always the answer any of the cttees always produce, and the govt happily jumps on it. And in this case they are vague as to what it might be; the usual "throw some more words at the problem" approach.
Although the reports asserts that GCHQ assesses that Russia is a highly capable cyber actor with a proven capabilityto carry out operations, all the examples it then gives are either abroad, or mere attempts. There's nothing about actual success in the UK. This seems rather a large gap. Are we forced to assume that Ivan's successes against the UK are so brilliant (and well hidden?) that we'd better not mention them? There is a link to Reckless campaign of cyber attacks by Russian military intelligence service exposed which do appear to be reckless and rather badly targetted, unless they really intended to damage their own central bank.
Continuing, Russia’s promotion of disinformation and its attempts at broader political influence overseas have been widely reported, which is nice, but this is all publicly available stuff and so also rather dull. They do have the grace to say We note that Russia’s disinformation efforts against the West are dwarfed by those which the Russian statec onducts against its own population.
By para 31 we're onto The UK is clearly a target for Russia’s disinformation campaigns and political influence operations and must therefore equip itself to counter such efforts. Unfortunately, being the sort of people they are, their ideas for doing this are all fun sekrit stuff, rather than the dull but necessary business of building civil society. For example, we could have a govt that people trust to provide statistics on Covid deaths, thereby helping to remove FUD. And then predictably enough they go in for another round of fb bashing; clowns.
I think that's enough great analysis for now. Oops no just one little extra gem: The impact of any such attempts [Russia sought to influence the2016 referendum] would be difficult – if not impossible – to assess, and we have not sought to do so looks like a cop-out.
Refs
* BlueSkiesResearch.org.uk: Back to the future; ATTP: Climate sensitivity – narrowing the range (and links therein);
27 comments:
There was some weak evidence I saw suggesting more Yoof were getting it, and they don't tend to die.
Not so much that more yoof are getting it, but that they're being tested more. Younger people have probably always been getting it more due to being more mobile, meeting more people.
In the beginning people were mostly getting tested as they were being hospitalised. Being hospitalised very likely indicates high risk for death (i.e. being older). That's changed as test capacity has increased. This CDC page shows amount of testing by age group and the vast majority of testing in the US has been performed on people under 65.
Our world in data has a big spike on June 26th which obscures trends... maybe due to a state adding new deaths in a retrospective analysis? Worldometer doesn't show that spike - maybe they reallocate retrospective deaths to the previous periods? In any case, in worldometer, the 7 day average is now 60% higher than its low point on July 5th and the trend appears to be up... unfortunately.
https://www.worldometers.info/coronavirus/country/us/
-MMM
Aside from the effects mentioned (age of infected, proficiency in treatment) there is the fact that deaths often lag diagnosis by several weeks. In fact, the last week has seen sharp increases in the number of daily deaths.
Confirmed cases don't have the same meaning over time. Apples to the left, oranges to the right. Apricots stuck in the middle. Remember that the early days in NYC people were mostly tested as they were being moved to the ICU, later on hospital admission, still later on symptoms, now at least in WA State you can generally get tested by just asking for a test. Test positive rates were over 50%. Now under 5%. Drive up testing and generally more testing means the positive tests are earlier in the infection, and more are asymptomatic. Just to make things more fun, the CDC (mostly non-political) has been replaced with HHS, (mostly political) and predictable chaos and missing/untrustworthy data abounds.
And yes, deaths are rising. Yesterday 1,119, highest since June 7th.
Oh, and this would be a good way to monitor over time.
Sewage has information.
https://www.washingtonpost.com/climate-environment/2020/05/01/coronavirus-sewage-wastewater/?%20environment_2
> deaths often lag diagnosis by several weeks
Ah, perhaps I failed to point out the disparity between the initial curve, when the lag was small, and now. Although as Phil points out, that may be due to changing circumstances.
Incidentally, anyone wanna bet? Daily deaths in the US won't go above 2k.
Alas, I don't bet. If I did, I'd think exceeding 2k for a single day count would be close to coin flip odds. A couple data points to inform my guess:
1) the low point of cases/day was around June 10, at about 21,300.
2) the low point of deaths/day was July 5th, at 517
3) cases hit a plateau around July 17 at about 68,000/day
extrapolating: with a 25 day lag, we'd expect to hit 68/21*517 = 1700 deaths/day around August 11th.
alternatively: in the 18 days since July 5th, we've seen an increase from 517 to 862. That's about half the time to August 11th, so then we'd expect to peak at around 1200 deaths/day.
some caveats:
1) testing has been increasing, such that we might want to adjust older case data upwards to compensate. This would lead to a decrease in my mortality projection
2) the mortality low was the July 4th weekend, which might have artificially depressed deaths. So increase the projection
3) deaths are presumably still being undercounted, and my guess is that the undercount will be worse in places that are run by republicans - e.g., Florida, Texas, Arizona, etc. This would probably depress future deaths relative to July 5th deaths, as I'm guessing that a higher percentage of future deaths will be in those republican states. So lower the projection.
4) all my calculations above were with 7 day averages. Single day counts can be a couple hundred above the average. So if the 7 day average is in the 1600-1700 range, there will probably be a single day which would exceed 2000 at some point.
(and now the latest single day mortality count was 1205, after yesterday's 1165. These mortality rates are way higher than should be acceptable...)
-MMM
I certainly hope you are right on the daily deaths but I fear that you are not. I certainly would not be party to such a macabre bet.
Sometimes you make a bet hoping you lose. Like buying life insurance. This would be one of those cases. No reason for me to bet on this.
Yet there is still a data quality problem. Deaths in most countries, including the USA, are likely undercounted. I'd suggest anyone that wants to bet frame the payoff in terms of excess deaths.
Oh, speaking of bets, what you think about the Arctic sea ice, and the odds of a new minimum record this summer?
Ah, perhaps I failed to point out the disparity between the initial curve, when the lag was small, and now. Although as Phil points out, that may be due to changing circumstances.
Part of that is USA did an abysmal job of counting cases at the outset but is doing reasonably well now. Initially they were not capturing pre-symptomatic cases.
The USA is doing a poor job now of counting cases. Not nearly enough testing for the number of cases. True rate is several times the measured rate. Poor is better than abysmal.
Infection => illness => hospitalization => ICU => death
Each with a lag time and a percentage going a different direction.
https://nyti.ms/2WOwXnj
Sea ice: interesting, isn't it? Just to be ornery, I'd be prepared to bet on no new min this summer, if anyone wants to take the other side.
"Incidentally, anyone wanna bet? Daily deaths in the US won't go above 2k."
No effin' way dude ...
https://www.cdc.gov/nhsn/covid19/report-overview.html
The 7-day centered rolling average for deaths took an ominous bend (lower slope) on July 15th, the same day Small Hands took those midget fingers to the data.
Effin' paramilitary police state.
What was it you all said four years ago about Small Hands? Worst prognostication ever. That dipshit would sell his own kids and grand-kids into slavery and/or prostitution if he thought that would win him the election come November.
On sea ice, I'd argue that the chance of a new minimum is still under 50%. 2012 was a really exceptional year. If we look at the 5 years with the lowest extent on today's date other than 2012 (e.g., 2019, 2017, 2016, 2011, and 2007), look at the difference from 2020 to that year, and then apply that difference to the minimum for that year, only 2016 and 2007 would beat 2012. And given reversion to the mean, I'd argue it is likelier for the difference between 2020 and previous years to decrease than to increase. So that converts to a less than 3/6 chance for 2020 to be a record year.
Similarly, if we apply the difference from 2020 to the 2011-19 average (6.58 to 7.47) to the minimum of that average (4.49), we get 3.6. 3.6 is still larger than the 2012 minimum of 3.39.
So, yeah, both calculations point to less than 50% chance of a record.
-MMM
Talk about flattening the curve, Small Hands would take a 365-day rolling average of Arctic sea ice extent. Then take a Sharpie to that graph to make it look like we were at the Last Glacial Maximum.
You just don't give numbers to a person who has gone bankrupt at least six times, ever ...
https://www.washingtonpost.com/politics/2016/live-updates/general-election/real-time-fact-checking-and-analysis-of-the-first-presidential-debate/fact-check-has-trump-declared-bankruptcy-four-or-six-times/
UK is somewhat ahead of US in both deaths per 1m population and further past their peak.
Here are UK new cases on 7 day average basis
July 8 545
July 9 554
July10 552
July11 581
July12 600
July13 625
July14 598
July15 586
July16 584
July17 610
July18 610
July19 621
July20 628
July21 635
July22 638
July23 656
If R is greater than 1 that is causing the increase we should expect growth to be exponential or perhaps worse if further easing of lockdown restrictions occur.
A different explanation might be that we could be getting better at finding milder cases.
It could of course be a bit of both and/or different reasons.
So a possible question to bet on is whether in 2 weeks time this growth will look above or below the mid point between linear and exponential growth.
Not sure I particularly want to bet but if forced to choose a side, I think I would prefer to go for the optimistic lower side.
UK US France
Apr 15 Cases (7da) 4884 30269 3451
May 1 Deaths(7da) 674 1982 335
Jul 8 Cases (7da) 545 54585 536
Jul 24 Deaths(7da) 63 918 9
Apr deaths per case 0.13800 0.06548 0.09707
Jul deaths per case 0.11560 0.01682 0.01679
Improve factor 1.19382 3.89346 5.78126
Formatting will probably be terrible sorry. Seems to question why US was used for puzzle. Is the puzzle more of a why hasn't the UK improved at finding milder cases as much as other countries?
@-WC
"Incidentally, anyone wanna bet? Daily deaths in the US won't go above 2k."
You may be right, although as of 1st August the daily deaths have reached ~1.4k.
But the total deaths from a brief peak above 2k are likely to be less than a month or more at 1K.
It is how fast the infection rate can be locked down in a region rather than the size of the initial peak that matters. The amount of lockdown being re-imposed in those US states that 'liberated' (Florida, Georgia, Texas) is apparently a matter of politics rather than a measured response to the rate of spread. That does not bode well for the reversal, or even flattening of the curve.
You would have lost William, quite unfortunately: https://www.barrons.com/news/us-tops-2-000-deaths-in-24-hours-for-first-time-in-three-months-johns-hopkins-01596761106?tesla=y
I was tempted, albeit briefly, by William’s bet. Had I done so, I wouldn’t currently think of accepting any of his money, even if he offered it - my assumption would have been that the 2k figure was a seven day average, daily figures being noisily variable. The worldometer site I use has the daily death rate at about 1,100 (and falling) so I think I was wise not to accept the wager..
The 2k "prediction" was deliberately risky, and mostly intended to crystallise opinion, in which it succeeded: no-one felt confident in taking the bet. The stats I'm seeing, per A, don't look like 2k was exceeded (I'm using the FT day-by-day for convenience: https://ig.ft.com/coronavirus-chart/?areas=usa&areas=gbr&areasRegional=usny&areasRegional=usca&areasRegional=usfl&areasRegional=ustx&cumulative=0&logScale=1&perMillion=0&values=deaths). the Barron's story unfortunately doesn't link to actual data and I couldn't easily find it at JHU. But the FT 7-day avg is currently at ~1k, slightly below the peak; and new cases appear to be slowly declining too.
John Hopkins University figures are at
https://gisanddata.maps.arcgis.com/apps/opsdashboard/index.html#/bda7594740fd40299423467b48e9ecf6
I think Barrons just used one update being earlier than another to get 2 days of deaths "reported in 24 hours" to make a headline.
Thanks. That gives me a funky map, which is quite nice, but I totally failed to find a times eries of deaths in the US from it.
I'm sticking to my original Small Hands paranoid conspiracy theory. Also CIP is wrong, there are no daily tallies above 2K ...
https://github.com/CSSEGISandData/COVID-19/tree/master/csse_covid_19_data
You have to download csv files for the JHU time series, then correct Spain, Peru, Iceland, UK, India, ... based on actual country websites (JHU is now rather notorious for skipping seemingly random dailies for just about all countries, it is now rather annoying to correct the ones that I have accidentally tripped over to date).
Then there are the under counts based on mortality data ...
https://www.nytimes.com/interactive/2020/05/05/us/coronavirus-death-toll-us.html
https://www.nytimes.com/interactive/2020/08/12/us/covid-deaths-us.html
I'd expect the under counts to be less troublesome for the EU (excepting the UK for the moment) and very much more troublesome for places like Iran, Iraq, Russia, Peru, Mexico, India, South Africa, Columbia ... do they report a death or just go bury them in their neighbors backyard or just go with a funeral pyre?
For the UK it is now a real mess (but nothing like in the US where Small hands is literally pulling POB's out of the ground, tangential but illustrative nonetheless) ...
https://coronavirus.data.gov.uk/cases
https://www.gov.uk/government/publications/phe-data-series-on-deaths-in-people-with-covid-19-technical-summary
Where you now get to pick from six columns (in two tables), all several thousand deaths less then what was being reported just say three days ago.
"William M. Connolley said...
Incidentally, anyone wanna bet? Daily deaths in the US won't go above 2k.
23/07/2020, 11:39"
Someone should've taken these odds!!
Next bet, when will the weekly daily average drop below 2000? January?
Post a Comment