2005-09-10

Probably not betting on climate with Lubos Motl

James Annans stuff refers.

Lubos Motl is a string theorist who thinks his opinions on GW are worth something [1]. Normally they aren't, but since he believes that warming and cooling are equally likely in the future, there is scope for a bet in which both sides think they are getting good odds.

James already has even odds on warming/cooling over the next decade from some unwise Russians, which is a good bet if you can get it (I've offered to share the exposure with him but he isn't taking; I'd even offer a premium). Lubos doesn't offer even odds (he isn't stupid, after all). He is looking to bet on a straight warmer/cooler from 2003 to 2013. He reasons that those who accept the consensus would think the odds of this to be about 1:100 on warmer; his odds are 1:1; so splitting the difference with a geometric mean gets 1:10 and he offers a bit less than this.

The trouble is interannual variability. The shorter the time period, and the fewer years for your endpoints, the more chance of the "wrong" result coming out even if the overall trend is upwards. To illustrate this, here is the CRU annual global temperature record (click for larger version). The bottom pic is a blow-up from 1970 (arguably the warming didn't start till the mid-70s due to sulphates, so I'm slightly doing myself down by starting from 1970, but no matter, I fudge that later), the two red stars (and the green ones ten years later) show the (as it happens, two) pairs of years when the temperature 10 years later was cooler. Since we all agree that the data since 1970 show warming (even those who believe the data is contaminated by UHI, alien spaceships and bits of string still agree that the data displayed show warming). If you choose a predition-time of 5 instead of 10 years, then there are 12 such pairs (5 is particularly bad: the values are (13=0; 12=1; 11=2; 10=2; 9=3; 8=3; 7=2; 6=9; 5=12).

So anyway, a rather rough calc (projecting the past into the future) then gives odds of cooling between 2003 and 2013 at about 2-3 to 25. Lets call it 1:9 (i.e. I think a fair bet is me putting up 9X for a chance of winning X; then my expected gain is 9/10*X-1/10*(9X)=0). So taking geometric averages (which Lubos asserts is "fair") gives odds between me and Lubos at about 1:3.

Lets do a quick sanity check on whether 1:3 seems fair to us both. If Lubos is right (in his assesment of the odds as 1:1), his expected gain is 0.5*3X-0.5*X = X. If I'm right (at 1:9) my expected gain is 9/10*X-1/10*3X = 6/10*X. Oops. Wrong: they should be the same. So we require odd 1:y such that 0.5*y-0.5 = 9/10-1/10*y, i.e. (y-1)/2 = (9-y)/10, i.e. 12y = 28, y = 7/3 (quick check: (7/3-1)/2 = 2/3 ?=? 2/3 = (9-7/3)/10 yes). In which case our expected gains are both 2/3 of our stake. So it looks like geometric averaging is wrong. Interesting, because it sounded plausible. I think that equalising expected gain is the way to get a fair bet, and the error in my calc above isn't immeadiately obvious. Also it pushes the odds into my favour, so I'll leave it for the moment.

So there we are: I offer Lubos (or anyone else credible) odds of 3:7 that 2003 is cooler than 2013 (ie, if 2013 is cooler I pay over 7*X; if its warmer I get 3*X; X negotiable but at least 500; currency dollars or pounds). I have (rather faint) hopes of getting better odds out of Piers Corbyn, so anyone interested had better strike now while the iron is hot & before I discover the flaw in my logic above...

OTOH difference-of-two-years is a noisy statistic. A better bet is on trends. From the above data, the trend is about 0.18 oC/decade. For the future, Lubos predicts a trend of 0; I predict same-as-the-past; splitting the difference, what about an even-odds bet on a trend, between 2003 and 2013 (inclusive; standard LS fitting) of above/below 0.09 oC/decade? As it happens, doing that since 1970 produces 3 11-year periods when the trend has been less than 0.09. I'd be more comfortable with trends. For one thing, it makes the bet more interesting, as you can compute the trends out at 5,6,7,8,9 years with some hope of guesing the 10th; whereas with diff-of-years the last is less predictable so the tension is less.

Bush is a disaster...

From Snopes via James Annan:


[Note: if you saw a sick green face, then so did I, and I'm confused: do they keep changing it? I've replaced the direct Snopes img with an indirect one (to JA's cached one, in fact) - WMC]

2005-09-06

Bush to lead inquiry into Katrina

Radio 4 says: "Bush to lead inquiry into Katrina: US President George W Bush says he will lead an inquiry into how the Hurricane Katrina disaster was handled."

I can see it now: "So George, did you totally f*ck it up?". "No George I didn't". "Well George, that seems fair enough: after all, you're a complete bozo, who would expect you to do anything useful?".

At least in the UK we put a thin veneer of honesty over the process by getting a nominally independent judge who can be relied on the discover the right things, rather than let people investigate themselves. Banana republic, anyone?

[Update: Miriam points out this: "So I'm asking Congress, please investigate this now. Take whatever idiot they have at the top of whatever agency and give me a better idiot. Give me a caring idiot. Give me a sensitive idiot. Just don't give me the same idiot."

GW, methane and vegetarianism: http://www.earthsave.org/globalwarming.htm

A reader would love to see http://www.earthsave.org/globalwarming.htm dissected. Hmm. Well, speaking as a vegetarian I'm all in favour of it, but for moral / animal welfare issues. The "vegetarian footprint" is smaller than a meat eaters, but is it really enough to be a factor in GW? Lets read on...

Global warming poses one of the most serious threats to the global environment ever faced in human history. Yet by focusing entirely on carbon dioxide emissions, major environmental organizations have failed to account for published data showing that other gases are the main culprits behind the global warming we see today. As a result, they are neglecting what might be the most effective strategy for reducing global warming in our lifetimes: advocating a vegetarian diet.


Hmm, hyperbolic, and as a first guess they are just using GW to push their pet idea, but I guess they have two points they are asserting:


  1. Methane is more important than CO2
  2. Meat eating is a major source of methane


Both of those sound dodgy, so how do they back them up?

Firstly, the radiative stuff. The IPCC fig 3 shows methane as about 0.5 w/m2, ie about 1/5 of the well-mixed GHG forcing and therefore about 1/3 the size of CO2. Earthsave are relying on Hansen, PNAS to bump the methane up from 0.5 to 0.7 by adding in some of the tropospheric ozone and (it looks like) all the stratospheric water vapour forcing, so making methane about 1/2 of CO2. Hansen then attributes sulphate aerosol, etc, to fossil fuel combustion (fair enough) and then offsets this against CO2 (hmmm) and then asserts that "the processes producing the non-CO2 GHGs have been the primary drive for climate change in the past century". Not very sure about that, but probably not much use even if true in predicting the future forcing, because sulphate to CO2 ratio is predicted to decline. Also, Hansens version of aerosol forcing seems to be rather larger than other peoples, which is why (I think) he gets them offsetting CO2. Compare the IPCC (aerosol indirect effect) with Hansens equivalent (forced cloud changes) and the range is similar, but the IPCC writes "very low" for the confidence; the range includes zero; and (AFAIK) the effect is entirely absent from the GCM studies that end up reproducing the cliamte change of the past century. On Hansens figure the range no longer includes zero; the confidence is unqualified; and there is a nice blue bar drawn down to -1 to guide your eye to the obvious conclusion.

Now its possible that Hansen is right, but I don't think its fair to represent his views as mainstream (earthsave tells me that Hansens results are generally accepted by global warming experts, including bigwigs but I'm not a bigwig, so I wouldn't know; they also reference the UCS review in their favour, but earthsave's version "the Union of Concerned Scientists had the data reviewed by other climate experts, who affirmed Hansens conclusions" is a misrepresentation of the UCS's far more tentative position), although this is a bit out of my area so I'm unsure. And even he doesn't think the CO2/aerosol balancing (as he would put it) can continue. Comments from the lurking Schtick welcome.

So... methane bigger forcing than CO2, dodgy (and then they totally lose my sympathy with "Whereas human sources of CO2 amount to just 3% of natural emissions..." which is septic garbage). What about the second point: "the number one source of methane worldwide is animal agriculture."? They reference the US EPA for this (which is odd, because they say *worldwide*, then ref the EPA US-only figures), who say "Methane is produced primarily through anaerobic decomposition of organic matter in biological systems. Specifically, methane is emitted as a result of the decomposition of organic wastes in municipal solid waste landfills and from agricultural and biological processes related to wetland rice cultivation, livestock digestion, and waste production. Methane emissions also occur during the production and distribution of fossil fuels such as coal, natural gas, and petroleum". But under the "agriculture" heading they say "The normal digestive processes in ruminant livestock (known as enteric fermentation [known as cows farting - WMC]) account for the largest portion of methane emissions.". So from this I guess that most of the *US* agricultural methane comes from cows, but probably not most of the total methane; and the global picture is likely to be different (and remember, Hansens figures were all global, so I don't think going back to a pure-US view is defensible). In fact, the table lower down resolves the uncertainty: the largest (in the US) is landfills, at 131 (Tg CO2 equiv in 2003); natural gas systems at 131; and cows farting at 125. And the total is 545. And globally? I don't know. wiki says 17% from cows, but cunningly doesn't venture whether this is global or not; the implication should be that it is. Ah... but http://cdiac.esd.ornl.gov/trends/meth/ch4.htm says "For flaring and venting of natural gas, estimated methane emissions rose from 0.0 in 1860 to a maximum of 29.3 million metric tons in 1973, then declined. For oil and gas supply systems, excluding flaring, estimated methane emissions rose from 0.0 in 1860 to a maximum of 18.0 million metric tons in 1994. For coal mining, estimated methane emissions rose from 2.2 million metric tons in 1860 to 49.5 million metric tons in 1989, then dropped slightly. For biomass burning, estimated methane emissions rose from 9.8 million metric tons in 1860 to 38.0 million metric tons in 1988 and subsequently declined slightly. For livestock farming, estimated methane emissions rose from 25.6 million metric tons in 1860 to 113.1 million metric tons in 1994; this appears to now be the largest individual anthropogenic source of methane emissions, having overtaken rice farming in the early 1980s. For rice farming and related activities, estimated methane emissions rose from 40.1 million metric tons in 1860 to 100.8 million metric tons in 1994. For landfills, estimated methane emissions rose from 1.6 million metric tons in 1860 to 40.3 million metric tons in 1994. Total estimated anthropogenic methane emissions rose from 79.3 million metric tons in 1860 to 371.0 million metric tons in 1994. During the period 1860-1994, the relative importance of the various component sources changed, with fossil fuels increasing and agriculture - although still dominant - declining in dominance. Within the agricultural sector, livestock replaced rice as the leading component."

To summarise that lot: yes they are probably right: livestock probably is the major source of methane, but is only about 1/4 of it. Then they continue: "Simply by going vegetarian (or, strictly speaking, vegan), we can eliminate one of the major sources of emissions of methane..." errrrmmm yes, good point there folks, and probably a good idea not to put it at the top: you need to be vegan to get rid of the cows, not just veggie; and not many can cope with becoming vegan (I couldn't). More: "there is no limit to reductions in this source of greenhouse gas that can be achieved through vegetarian diet. In principle, even 100% reduction could be achieved with little negative impact". Well no, this is wrong: since cows are only about 1/4 of the methane sources, you can only cut out 25% even with the whole world vegan. More: "efforts to cut carbon dioxide involve fighting powerful and wealthy business interests... vegetarian foods are readily available, and cuts in agricultural methane emissions are achievable at every meal" sounds like wishful thinking to me.

Conclusion: they probably have a reasonable point but they push it too far.

2005-09-05

Hurricanes and SST, technical

The RC "Katrina" post is up - go look and comment, if you haven't already. I want to talk about one issue, see comment #34 Higher temperatures mean higher energy levels, but in thermodynamics, it is the difference in temperatures that determines how much power a system outputs... explain the temperature difference that drives hurricane systems and how GW is expected to increase that temperature difference. The point being, is it *SSTs* going up that you expect to drive more hurricanes, or is it the *difference* between SSTs and "the top", whatever that might be? My answer was Much of the power for the hurricanes comes from latent heat: the condensation of atmospheric moisture as air parcels are raised. Warmer air leads to more moisture (roughly exponentially), so no T diff would be needed and I still like it, but it doesn't seem to have found much favour. Isaac Held said it is temperature differences that are fundamental, and not, for the most part, the temperature itself... It is the temperature difference between the ocean surface and that of the upper level outflow that is crucial. From this perspective one can see that the issue of hurricane intensity is linked with that of trends in upper tropospheric temperatures.... To which I reply I'm sticking with my view for the moment, bolstered by the fact that everyone seems to correlate hurricanes against SST and I've never seen anyone correlating them against upper temps....

From this, I hope its clear that I'm unsure about all this... if anyone feels inclined to supply useful info, please comment.

So: the idea that everyone is talking about SSTs and no-one is talking about upper air temps is meta-evidence that they don't much matter, but that is not in itself terribly convincing. What I want to do is look at some nice words by Kerry "intensity" Emanuel himself. See http://wind.mit.edu/~emanuel/anthro2.htm (which will, if you look carefully, link you to a PDF of his Nature paper if you want it). And in fact the one we want turns out to be this about theoretical max intensity, and the section physical basis of limit calculations.

First off, the efficiency E is (T_s - T_0)/T_s. T_s is the "heat source" - the ocean; and T_0 is the exit temperature. So at first sight this is promising for the "upper air"-ists. But wait... equation (4) is for the max wind speed, but T_0 has gone and T_s is still there. OK, its because T_0 is wrapped up in E. And... "Finally, one has to estimate E. To do this, one has to first estimate T_0, the temperature at which air flows out of the top of the storm; this is also equivalent to estimating the altitude of the storm top. This accomplished by finding out how high up in the eyewall the air remains warmer than the distant environment, and is straightforward to assess given the vertical profile of temperature in the storm environment." Which I take to mean that he is doing some parcel-ascent calculations based on T_s and the atmos profile.

Lets also try a PDF of a Nature paper of his from 1987 here. Again, we have the E factor (e.g. eq (1) or (4)). Again, the calc of E has come from T_s, profiles, and parcel ascent. And a bit later we get, paraphrased, "The pattern of intensity largely matches the SST pattern, but non-linearly, because E is largely a function of the SST". Then he goes on to argue that the portion of changes in intensity (under climate change) due to climatic changes in E will be small.

So... all in all I still think I'm right and Emanuel agrees with me. But I'm willing to be told otherwise, if you know better.

ps: I haven't forgotten my two questions in the Q.

2005-09-01

Prez Bush is going to fly over Louisiana in a helicopter tomorrow!

...says the BBC r4 news tonight. And do what, I wonder? Put his thumb to his nose and go "nyah nyah, I'm floating around in a chopper and you're stuck in a flood"? How does this fit in with the other comment of his that they reported, that people should avoid unnecessary fuel use at the moment?

And just for balance, I'll also throw a brickbat at the ?Danish? env agency which has been shipping people off to Greenland for a jolly to look at retreating glaciers. Which is pointless. You can't *see* a glacier retreating from a visit, but you can by sitting at home comparing old and new photos. And you discover nothing about GW by looking at any one glacier. But option 2 isn't much fun and won't get you press coverage. It won't waste fuel and resources either, though.

Spam and comment verification

I've suddenly started getting spam comments. Deleting them is tedious, so I've taken bloggers advice and turned on "comment verification" which means you have to type in a bit of text before you get to comment. Sorry about that. It might not force you to do it if you're a registed user... let me know.

Hurricanes and Global Warming

For some odd reason the question of the linkage, or otherwise, between hurricanes and global warming is in the news at the moment. As to the details, I have rather little to say, on the grounds that hurricanes in the Antarctic are unknown. I will recommend this RC post if you're interested; also RP Jr has quite a bit to say about the issue recently. But I do want to make a comment about the attribution question. As far as I can tell, while its premature to say: "an increase in hurricanes can be attributed to global warming", its equally wrong to say "global warming has had no effect on hurricanes".

Which is why I find RP Jrs latest rant on ceding the high ground odd, because he apparently approves of James Glassman at TCS who sez Katrina has nothing to do with global warming. Nothing. Approving of anything on TCS is a strange thing to do, and I can't see why this one should be approved of. It looks like some kind of reverse-fallacy to me: failing to attribute to GW doesn't do the reverse, ie it doesn't demonstrate a lack of connection. Is it perhaps the "unexcluded middle" fallacy?

Having said that, the perceptive will notice that I welcome RP Jr back onto my blogline, and Sr (and not just because I got him to nuance his nuances a bit more).

Finding and Looting

How do you tell a "looter" from a "finder"? Its easy. See this from Wonkette (thanks Dave Mason via Planet Fleck).

Meanwhile... all this Katrina stuff (very interesting, true) and then... another 800 dead in Iraq, and not even for any kind of sensible reason: just a mass stampede. The madness of crowds.

2005-08-31

Emission scenarios and the IPCC temperature range

A reader asks, how do emission scenarios affect the IPCC 1.4 - 5.8C temperature range? Can we get a predicted temperature range for a Bush-style "business as usual" emission scenario, another range for moderate action to reduce emissions, and a third for drastic action?.

Short answer: [1.4,5.8] includes model and scenario uncertainty. fig 9.15 shows the T range across models and scenarios; fig spm-5 gives you a key to the various scenarios (or see this SRES fig). Of those, I think A1T and B1 correspond to fairly drastic action; IS92a was the old business-as-usual approximation I think. My pet preference would be HadCM3/IS92a as a base state: that gives you 3 oC at 2100. Switching to A1F1 would put the change above 5 oC; down to B1 puts it down to 2-and-a-bit.

Or if that is too short, read on:

The IPCC says The globally averaged surface temperature is projected to increase by 1.4 to 5.8°C (Figure 5d) over the period 1990 to 2100. These results are for the full range of 35 SRES scenarios, based on a number of climate models (here). There is a footnote to this, which says: Complex physically based climate models are the main tool for projecting future climate change. In order to explore the full range of scenarios, these are complemented by simple climate models calibrated to yield an equivalent response in temperature and sea level to complex climate models. These projections are obtained using a simple climate model whose climate sensitivity and ocean heat uptake are calibrated to each of seven complex climate models. The climate sensitivity used in the simple model ranges from 1.7 to 4.2°C, which is comparable to the commonly accepted range of 1.5 to 4.5°C.

To interpret that: firstly, the *climate sensitivity* (equilibrium climate sensitivity refers to the equilibrium change in global mean surface temperature following a doubling of the atmospheric (equivalent) CO2 concentration (glossary) is about 1.5 to 4.5 oC. But T change to 2100 isn't necessarily equilibrium, so you can knock a bit (0.5-1.0 perhaps) off that range for non-equilibrium effects (except probably B1 and A1T (see here), which are pretty flat by 2100). This effectively leaves higher CO2 scenarios (like A1F1) adding about 2 oC for the effects of higher CO2.

Secondly, a technical point: all these scenarios haven't been run through all the GCMs, it would be too expensive. Most GCMs have (or had, when the TAR was written) only done a few scenarios. So a simple model is tuned to the model performance in one or two scenarios, and then the model is effectively used to interpolate to the other scenarios. For this post, that doesn't matter.

So, fig 5d shows that an "average model" has a spread of [2,4.5] for all the 35 SRES scenarios. Whereas the spread for all models all SRES is bigger, at the aforementioned [1.4,5.8]. You could try taking a single model and computing the spread across scenarios; or you could take a single scenario and compute the spread across models. The TAR sez: By 2100, the range in the surface temperature response across the group of climate models run with a given scenario is comparable to the range obtained from a single model run with the different SRES scenarios.

Then fig 9.15 provides the answer you were actually looking for (or nearly, because it does six illustrative SRES scenarios (don't ask me what they mean by illustrative) across 7 models, but that should be enough for a flavour of what goes on). Unsurprisingly, a higher base state sensitivity (GFDL) scales to a stronger response and hence greater range across scenarios.

Caveats and stuff. #1: I've never been terribly interested in the range for different scenarios. Clearly its a valid thing to ask, but given the large (AFAIK) uncertainties in all the emissions, I'm more interested in "what is the T change at (say) 2*CO2" rather than "what is the T change at 2100". #2: All this is taken from the IPCC TAR. I don't think things have changed much since then. #3 I (and most people) end to talk in terms of CO2 for simplicity; the SRES scenarios include other GHG's, and sulphates, and stuff too.

Ask Stoat

Shamelessly copying RP's "ask prometheus" feature, I've added an "Ask Stoat" link to the sidebar, which directs here. So, that means I'm inviting you to submit climate-science-type related questions for my careful analysis. I'm not anticipating any great flood, but if there is, you'll have to wait your turn in the queue... Submit your questions via comments on this post, or email. And this may be a good point to mention that I'm tending now to use wmconnolley@gmail.com as my "public face" email, though at the moment it just redirects to the obvious one.

2005-08-30

Barton, belatedly

Curiously the Grauniad has belatedly discovered the evil Barton story. Why now? And it was on R4 at 10 o'clock too. Why now? Is it because they were waiting for some kind of environmental peg (Katrina) to hang it on? If anyone has a better idea, please let me know. The story is more than a month old: it was on RealClimate on July 18th.

McIntyre the Sock

It looks like Steve McIntyre has stooped low enough to using sock puppets. Tim Lambert caught him, and SM seems to have admitted it. Tut tut! And in sci.env too, not only at Tims blog. We also discover who "Per" was, though the answer doesn't appear to be especially interesting.

SM's puppetry was suspected at the time: Nigel rears his ugly head again, I see. Are you a colleague of McKittrick's by any chance, Nigel? The only time you make an appearance here is to defend him... as David Ball put it.

2005-08-29

Relax!

The headline was prompted by JF's tribalism: Frankie, anyone? Incidentally, translations of the cryptic references are available on request, if you find them too cryptic.

To understand this (if you really want to) you need to read http://climatesci.atmos.colostate.edu/?p=36#comments by RP; and JF's post ref'd above. Note, BTW, that RP has removed some of the comments from his blog (even James Annan gets rubbed out, along with the wackos), which explains why the comments refer to comments that don't exist and why the numbering is all wrong. Argh!

So: JF complains that I'm being too tribal in being interested in an answer to the question do you think most of the warming observed over the last 50 years is attributable to human activities?. It seems a fair enough question to me. And presumably to RP too, since he answered it "I do". I asked it because I thought his previous answers were ambiguous (and in the end the question turns out to be ambiguous too: see lower down). And other people thought so too, because several people commented on his blog (sadly those comments now seem to have been deleted) that the question I asked was unreasonable; or that RP had said the answer was no (I wish the comments were there so I could quote them rather than rely on memory). Those comments weere of course proved quite wrong, when RP *did* answer the question. And I'm reminded of a wise comment by James Annan, with ref to a post where RP Jr made it quite obvious that he accepts the IPCC consensus, that its very amusing to see the pain ond outrage on the part of the septic ditto-heads when they see such unambiguous statements, because they really thought that RP Jr was on their side. Now that simply isn't possible without some dense and/or ambiguous language (the septics are dumb, yes, but not totally so).

Now for myself, I'm quite happy to accept the IPCC consensus position (slightly updated with post-TAR research, e.g. the most recent MSU stuff) and don't feel any need to have my own position. RP Sr *does* have his own position, and... well, read his blog to find out what it is: thats part of what its for. Starting here perhaps... I got a bit lost in the maze of responses to Andy Revkin. RPs Sr's position is in fact at variance with the IPCC one, because although he agrees on the human influence (see above) he doesn't agree on the cause: which shows that far from questioning too much, I stopped too soon: because Is most of the observed warming over the last 50 years likely to have been due to the increase in greenhouse gas concentrations gets a far more nuanced response from him. Since I agree with the IPCC response, I disagree with RP Sr's nuances, and would simply answer the question with "yes".

A trick from Penrose

I'm reading Penrose's "The road to reality". I got it for Christmas and after a burst of reading then, haven't got much further. Our just-finished trip up the Old West River (pic: a bit down from the GOBA mooring at sunset yesterday) gave me some computer-free evenings to restart reading it. I discovered I was only 3 pages away from the end of the "maths" sections and the start of the "physics" bits, so finally got to read some of the physics.

Anyway, having struggled about 1/2 way through the text (to ch 22, Quantum algebra, geometry, and spin) my review is: very heavy going; good though; probably rather individualistic in places; maths degree or equivalent a bare minimum requirement. On that latter point: I found it very funny that having lead us through various infinities, Ricci tensors, fibre bundles (still not really sure what those are), gauge connections, etc etc with occaisional nods back to "see the defn on page XX if you've forgotten what index-raising is...) in section 21.1 we have the perfectly normal differential equation y + d^2y/dx^2 = x^5 with (see section 6.3 for the meaning of the symbols). Really! If you don't know what a differential equation is, you're totally stuffed, and ref to 6.3 won't help you. Quite possibly the same is true of the back-refs to Ricci tensors, but I just blip over them...

But, to come to the trick, its in solving the ODE above... taking d^2y/dx^2 + y = x^5, we re-write this as D^2 y + y = x^5, ie (D^2 + 1)y = x^5. Now we treat D as a simple number, and write y = (D^2 + 1)^-1 x^5. This being so, we do a formal series expansion, and get y = (1 - D^2 + D^4 - D^6 + ...) x^5. Since D^6 x^5 is zero (as are all higher powers), we get y = x^5 - 20 x^3 + 120 x. Which is the right answer.

This is a neat trick. I can't remember if I was ever taught it, or even if its commonly known. Did you know it? Then tell me!

Incidentally, M took Beethoven Klaviersonaten Band I to read.

2005-08-25

RSS data now available...

For some time now it has been a bit frustrating that S+C make their global-average data available, but RSS don't. RSS make the gridpoint data available and I roll my own averages, but still its a lot easier (and less error prone) for the originators to do it.

So credit to Roger Coppock for actually *asking* Mears if the averages are available, and... yes they are. See this sci.env thread for the data.

"Ask and Ye shall receive" as the good book says.

Incidentally, a little quibble: Mears says We do not provide data south of 70S for TLT, due to the high altitude of the Antarctic icecap. When the land (or ice) is this high, TLT is no longer measuring the atmosphere!. What do S+C/UAH do?

[Note strenuous avoidance of the words "Spencer" or "Christy" to avoid disputing JA's place at the top of the google order].

2005-08-22

Anyone for a job?

Would you like to be a climate modeller? Then follow http://www.antarctica.ac.uk/Employment/vacancies/job.php?id=381.

New THC paper

There is a new paper intercomparing the response of the THC to increasing GHG forcing up to 4xCO2, more evidence for the view (see posts here) that the THC won't collapse.

Gregory, J.M., K.W. Dixon, R.J. Stouffer, A.J. Weaver, E. Driesschaert, M. Eby, T. Fichefet, H. Hasumi, A. Hu, J.H. Jungclaus, I.V. Kamenkovich, A. Levermann, M. Montoya, S. Murakami, S. Nawrath, A. Oka, A.P. Sokolov and R.B. Thorpe (2005), A Model Intercomparison Of Changes In The Atlantic Thermohaline Circulation In Response To Increasing Atmospheric Co2 Concentration, Geophys . Res . Lett . 32 ( 12 ): Art . No . L12703 Jun 23 2005

As part of the Coupled Model Intercomparison Project, integrations with a common design have been undertaken with eleven different climate models to compare the response of the Atlantic thermohaline circulation ( THC ) to time-dependent climate change caused by increasing atmospheric CO2 concentration. Over 140 years, during which the CO2 concentration quadruples, the circulation strength declines gradually in all models, by between 10 and 50%. No model shows a rapid or complete collapse, despite the fairly rapid increase and high final concentration of CO2. The models having the strongest overturning in the control climate tend to show the largest THC reductions. In all models, the THC weakening is caused more by changes in surface heat flux than by changes in surface water flux. No model shows a cooling anywhere, because the greenhouse warming is dominant.

2005-08-21

What is the point of the CCSP Committee "Temperature Trends in the Lower Atmosphere-Steps for Understanding and Reconciling Differences"?

A reader enquires about my take on "his [RP Sr's] precipitous resignation as chair of one of the CCSP committees in the face of an apparent revolt by the members: http://climatesci.atmos.colostate.edu/?p=30".

Well now, its all very interesting. This is my excuse for yet another MSU post.

First, some pointers to other folk who got there first: Scott Church guesting at Tim "I'm banning you :-)" Lambert's Deltoid (BTW, RC's hit counter is now past 400k, and will overtake TL soon...). James "Slashdotted" Annan dislikes Spencers slurs (I agree). Chris Mooney points to a few other links and curiously praises the Economists article, which I though was poor. But he does point out the curious press release policy on the 3 ScienceExpress stories. Also (can't resist this) it turns out that Spencer is a creationist. Weird or what. Thanks TP.

My take (summary): this committee has been thoroughly overtaken by events and no longer mattters very much. So, scientifically, has the S+C MSU record.

More detail: one (perhaps even the only) of the untidy ends of the IPCC TAR was tropospheric temperature trends, which appeared to be observed to be lower than they should have been (if you believed the GCMs and the sfc records). The skeptics made much of this; most climate scientists were, I think, rather less worried: the record was short, obs have errors, it was a puzzle that would be resolved. See various MSU/S+C posts here.

The puzzle became less puzzling as even the S+C/UAH trends got larger, and other analyses (RSS; Vinnikov and Grody; Fu) got even larger trends, and pointed to probable errors in the S+C trends. Nonetheless there remained an interesting puzzle, and in 2003 a meeting was convened to discuss it - I think ES attended. The meeting didn't really resolve anything, which in retrospect was no surprise. But it did decide to write a report. The prospectus, including lead authors and chapter headings, is at http://www.climatescience.gov/Library/sap/sap1-1/sap1-1prospectus-final.pdf (the "final" is now amusingly wrong, since RP has resigned), all nicely modelled on the IPCC model.

But the problem is that the report has been overtaken by events. Skipping lightly over the history, the three recent papers in ScienceExpress (see Et Tu LT? - and note only 25 comments on this major subject - proof that people don't comment so much on real science :-() show that:


  1. The S+C trends were wrong, by a large margin, because they made a sign error
  2. The radiosonde trends may well be too low too
  3. Models predict about 1.3 times as much warming in the trop as at the sfc


That last point quantifies the "models predict more warming in the trop than at the sfc". This was true, but by no means a major prediction: you have to struggle through the TAR to find any figures showing it. So finally Santer et al have got round to analysing what the models actually do predict.

Point 2 (oh dear I'm going backwards...) is the result of analysing radiation corrections to the radiosonde (balloon) record. Sondes thermometers are subject to solar heating in daytime, and need correcting, and the corrections are to some degree uncertain. The sonde record has never been great. Sherwood et al. suggest that the sonde trend is too low: its early days for this idea yet, but it may well be correct.

Point 1 is the biggie. Mears et al. have worked out that S+C made a mistake in applying a correction to the UAH MSU record. Spencer just about admits this, but in a distinctly weaselly way (in particular "This particular error is within the published margin of error for LT of +/- 0.05 C/decade (Christy et al. 2003)" in http://vortex.nsstc.uah.edu/data/msu/t2lt/readme.07Aug2005 is just blowing smoke): as I understand it, its a simple sign error, but he doesn't admit that. S+C have now made an awfully large number of different corrections to their record, and if they were showing large warming the septic crowd would be howling for their blood for repeatedly adjusting their trends. S+C were the first, but there is no longer any reason for giving their record primacy - far from it: despite all the corrections, their technique is still not beyond reproach. RSS is probably better.

So (if you've read this far) where does this leave the committee? In limbo. If those 3 papers had been available in 2003, no-one would have bothered convene the meeting much less set up a report-writing committee. Had the committee mananged to report in a timely way, it might have been worth something, but not a lot, because the main point was the errors in S+C's dataset and possibly in the radiosondes. So perhaps its just as well its late. They will probably feel obliged to publish something, but maybe they should just not bother.

And where does this leave RP Sr's resignation? I don't have a lot of sympathy for his POV, which appears to be The current discussion in the media based on the three Science Express articles misses the more significant issue of spatial trends in tropospheric temperature trends. This is just wrong, at least in terms of impact: the overwhelming issue, which caused the committee to be set up, was the difference in global average trends. It may not have been RP's interest, which may be why he is so miffed, but it was everyone elses.

2005-08-20

Hello world I'm back from Holiday

I'm back from hols, processed my mail backlog (1,273 messages, a new record, mostly because I forgot to unsubscribe to wiki-en before going off...), and realised I have a few things to catch up on (JAs bet in the Grauniad and Nature; the MSU papers finally coming out).

Speaking of MSU, it was interesting how little effect this earth-shattering news had on the real world: not a mention of it in the papers I was reading. Ho hum.

I did manage to get some climbing in though. Ynys Lochtyn has a seaward face, mostly a bit broken, but with some stuff steep enough to be worthwhile, though only about 20m high. The white-patched overlapped slab slightly L of centre is now called "Seal" (cos I saw one basking on a nearby rock when I finished). It goes up the slab (with some holds in the darkness on the R edge of the slab), then slightly L on the overhangs (a bit out of balance for a few moves) then up R on more broken ground. Possibly HS.

The corner in the R end of the pic goes straight up and is "Crab" (because looking down from the top I could see some down in the water. Futher off to the R out of shot is a slightly easier corner, "Dolphin", because I saw a few whilst belaying; Cardigan bay is good for dolphins), and might be S or a bit easier.

We also tried Cym Cywarch but the paths are very overgrown and we didn't find even the foot of the climb we were looking for. The valley is very beautiful though.

2005-08-02

Pielke Senior has a blog

RP senior has a blog. Its quite interesting, and its about climate. Its http://ccc.atmos.colostate.edu/blog/ if you want to look.

In my normal carping way I'm going to pick up various points with which I diagree. So don't treat this as a review of the blog overall (and in fact it would be rather presumptuous of me to "review" his blog overall, given his status (err, and mine...)).

Browsing, Pielke and Christy Comment on Hansen et al. Science paper entitled “Earth’s Energy Imbalance: Confirmation and Implications.” caught my eye. In it, they complain that Science won't publish their comment. Well, tough, I say: Science doesn't publish a lot of things. And when you get reviews back like:

The exchange is not worthy of publication. In fact, I do not understand why P&C even wrote their piece in the first place. They continually destroy whatever point they had in mind by noting Hansen ‘did it right’... None of the participants in this pathetic exchange seem to have the slightest clue about the large decadal noise that exists in the oceans and some ocean models.


then you're not going to get published. Thats ferocious stuff (there's another review, which is also highly critical, though more measured).

I find this interesting because it has shades of other controversies: Christy Spencer [oops, wrong one: thanks to TPa: here] whining that he wasn't asked to review Fu; and another one that I can't remember now. That particular post looks like a severe error of judgement to me.

Coming back to the MSU (I do seem to be getting a bit obsessed by it... sorry) elsewhere, RP complains about people saying that the surface and upper-air records of temperature change can now, in fact, be reconciled which rather suggests that he should be asking Christy about the vn5.2 dataset... Yet again elsewhere he notes that Recently, Christy et al. (2003) demonstrated a strong correspondence between their version of the MSU time series and several other independent measures of tropospheric temperature trends, and they conclude that the Mears et al. (2003) trend is likely too strong.. Which might have been fair enough when he wrote it, but blogging about it now, when even S+C admit that their trend is now the same as Mears, is a bit odd. It also points out that there will be a lot of rowing back to be done when S+C finally publish. There's also the interesting point (and I've said this on sci.env but not here): given that S+C *do* assert a good correspondence between vn5.1 and sondes, what are they going to do about the 50% larger trends in vn5.2? If it *still* matches the sondes, then the sondes are a poor test. If it doesn't... are they going to say their data is wrong? Or are they suddenly going to discover that the sondes aren't so good after all? Interesting...

BTW, speaking of Christy, the rumour is: August 11th. Just checking to see if you read through to the end...

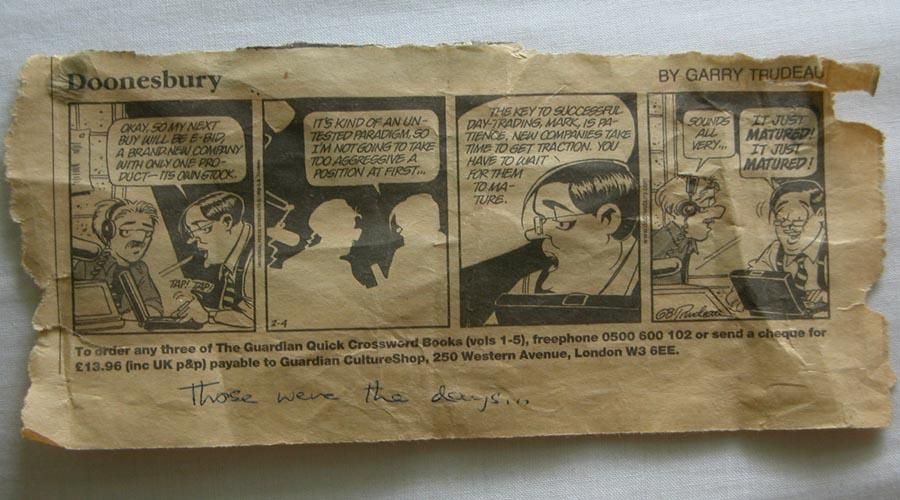
Those were the days... / View

It is the end of an era. Miriam's career with ATML/Virata/GlobespanVirata/Conexant is now over. But (and I) you need shed no tears for her: she gets to doss around all summer playing the piano before working with a new startup in the Autumn and beginning the process all over again.

There is no science in this post, of course.

The cartoon sums it all up: those heady dot-com days when we were all going to become rich with stock options (we didn't go in for any of the day trading stuff). Miriam kept it pinned above her desk as a reminder.

The company started as a Herman Hauser startup in about 1993. M joined in 1995 I think; in those days it was ATML. It was going to get rich in the 'ATM to the desktop ' revolution with ATM switches and network cards to replace Ethernet ones... Miriam started off in "diskbricks" which was some kind of raid-y thing for video serving. The ATM revolution never got off the ground, but fortunately DSL came along, and the company, renamed 'Virata' by then (after some long-forgotten piece of company product... it was the only suitable anme they owned the namespace for), was perfectly poised for it. DSL is based on ATM technology, and Virata made sale after sale after sale (Miriam helped with that bit...).

Then came the glorious days of the internet boom and the IPO when vast paper fortunes were made, and they moved to glorious custom-built offices in the science park (rather inconvenient that, it increased Miriams cycle ride from 20 mins to 35) with a glorious boardroom table in the shape of a curvy V and a round table for the dot on the logo. I shall draw a discrete veil over the crash times. All this was under the management of Charles Cotton, who seemed to be good. But! Then came the disastrous (and in retrospect, rather hard to explain) decision to "merge" with Globespan to form Globespan Virata, when CC left, and times got leaner, in a sense (in a sense, because there was still a huge cushion of IPO money; but the stock options became... uninteresting). And then a bit later the seal was set with the takeover by Conexant.

During all this process the company grew, and left the original Cambridge site far behind. Around IPO time (before?) it got a US presence that came to dominate the company, probably a loss, the culture starting shifting. All the mergers and aquisitions left the company with overlapping bits that no-one was brave or strong enough to kill. Various foreign things got bought (an Israeli company with a name designed to make it seem non-Israeli...) and then other bits got disposed of in the last 2-ish years of the "downsizing" phase when the management-speakers got the upper hand. The upper levels started saying things like "Our revenue is X. So our accountants say we should be employing Y people. So Z people are to become redundant" apparently without realising that if you lose (useful) people the productivity and income go down, so you then go through another round of "Our revenue is now X*0.8. So..." and round again. So in the end it turned into waiting your turn to get downsized... Miriam made it to the end, but it was depressing and she is happy to be out.

An amusing feature of the successive names was the game of spot-the-old logo in various places: the sign outside the building changed; but the V boardtable was never replaced and various layers of old names existed.

But even in death (at the farewell barbeque) the aura of money hadn't quite faded: comparing it to an equivalent type event at BAS (well, OK, we're not closing: but it was just the annual barbeque really) the amount of free stuff floating around was just... well.

If any of this sounds like mourning for the death of a dream, it isn't. Their products are basic stuff buried in modems (our most exciting moment came when a friend phoned up to say "we've just got a new modem and when it boots up it says Virata on it!" with chip names like Helium, Hydrogen, Claudius... but those may be the internal names anyway. It was probably useful stuff, but anything of any value still exists elsewhere. What was distressing though was how an enthusiastic creative bunch of people got managed into a pile of junk. So it goes.

And the obituary... here is the logo from the farewell tee-shirt :-)

Miriam says (I find this a bit surprising from the outside, but maybe I got to hear more of the bad stuff) that Virata is considered a Cambridge success story, with positive effects on their re-employment.

At one point this post was going to compare the inefficiency of Communism (no-one does anything) with Capitalism (everyone works to cross purposes and there is gross wasteful duplication, like 100 ants carrying a leaf pulling in all directions). But I can't be bothered to do that properly...

Meanwhile... back in the real world: do you think I should cut back our grape vine? This is the "view" from our bedroom window.

Polar amplification and MSU, combined.

A little while ago I write about the mechanisms of polar amplification of warming: which appear to be mostly ice-albedo feedback and the dynamical habit of the tropics of exporting information. The old favourite - inc GHG can have more effect when its cold - didn't seem to figure.

But now, idly googling for "Spencer and Christy" I came across S+C's report for 1978-2003. It will probably all have to be revised when the vn5.2 data finally becomes "official", but therein they offer this:

That cold air has very little water vapor in it, so if you add another greenhouse gas you have an opportunity to trap more heat. When you go to the tropics, where there’s lots of water vapor, the extra carbon dioxide doesn’t have as much effect. As a greenhouse gas, carbon dioxide’s greatest effect is in the driest, coldest places


I rather suspect this is wurble, with no analysis behind it: its an explanation in search of an effect. But its its interesting to see someone who (presumably) knows something about atmospheric radiation putting it forward. By contrast, Keith Shine (who very definitely does know about radiation) didn't recognise the idea (pers. comm.).

Another interesting feature of that report is that the second major headline of it is "The atmosphere is warming" in big letters. Oddly enough, the std.spetics don't seem to have picked up on that... in fact, I sometimes wonder if S+C have noticed, either...

2005-07-29

A tale of two oil companies...

One good and one evil? Maybe. But neither of them is Exxon.

If you've been reading the Economist recently, you'll find a 2-page advert from a nice chap who signs himself "Dave". But the letter head tells you he is really David J O'Reilly, CEO of Chevron. And he invites you to go to willyoujoinus.com. The headline is "It took us 125 years to use the first trillion barrels of oil. We'll use the next trillion in 30. So why should you care?". With my biases, I naturally assumed this was some pinko-leftist environmental type message. But... no. Reading the text (find the ad itself here though it crashes my acrobat 5.0) it says "Energy will be one of the defining issues of this century, and one thing is clear: the era of easy oil is over... Energy demand is soaring as never before and driving economic growth. And improved standards of living are requiring increasing amounts of energy... Many of the world’s oil and gas fields are maturing. And new energy discoveries are mainly occurring in places where resources are difficult to extract—physically, technically, economically, and politically. When growing demand meets tighter supplies, the result is more competition for the same resources... We can wait until a crisis forces us to do something. Or we can commit to working together, and start by asking the tough questions: How do we meet the energy needs of the developing world and those of industrialized nations? What role will renewables and alternative energies play? What is the best way to protect our environment? How do we accelerate our conservation efforts? Whatever actions we take, we must look not just to next year, but to the next 50 years...." and so on.

No mention of climate change, global warming, anything like that (just a v brief mention of "environment" and no more). It looks rather more to me like they are trying to excuse the current high price of oil more than anything else.

Searching for "climate change" on the Chevron website I found Chevron's Four-Fold Action Plan to Address Global Climate Change (ah, the four-fold way, glasshopper...) which "Support[s] flexible and economically sound policies and mechanisms that protect the environment... The use of fossil fuels to meet the world's energy needs has contributed to an increase in greenhouse gases (GHGs) -- mainly carbon dioxide (CO2) and methane -- in the Earth's atmosphere. There is a widespread view that this increase is leading to climate change, with adverse effects on the environment." This is fair enough (you wouldn't get Bush saying that) though a bit weak, and rather more importantly its buried.

My interpretation of the ad, then, is "yes we know that gas prices for your grossly inefficient SUV are going through the roof. But don't blame us". So they are the evil one.

BP has also been advertising in the Economist. They are keen to push their enviro qualities and have even taking to calling themselves "beyond petroleum". Some of this is just PR gloss: they're still in the business of selling fuel for people to burn, no matter that they're reduced their own emissions by 9%. they say: "One of the great challenges facing mankind is the increasing temperature of the planet. This increase is believed to be associated with the production and consumption of carbon based fuels – coal, oil and gas – which all increase levels of greenhouse gases in our atmosphere". But, they get marks for the PR. And they are even prepared to say "Based on current scientific opinion, we believe that it’s realistic to promote actions designed to stabilize carbon dioxide concentrations at around 500-550 parts per million, consistent with limiting global temperature rise to around 2°C". Which is a hard target to hit... I wonder if they are serious? Quite possibly... they have a list of policy options there. They link to an greenhouse effect animation from the Science Museum - so they score points for accepting the scientific view; they also get points for not comparing it to a greenhouse. OTOH they (or perhaps the science museum) loses points for implying that the GHE is caused my multiple reflections from the sfc to the top of the atmosphere. But maybe thats hoping for too much.

They even have a section on "Supporting Research". Woo-hoo! Looks good. Free money for cliamte research?!? Sadly no... a bit more applied: "We support the search for lower carbon energy alternatives and solutions to climate change. We sponsor research activities at leading universities around the world".

Despite that last one, I'll assign them to the "good" category for now :-)

ps: Chevron invite you to join their "discussion". However, with wacko postings like this:

...already provided the new science which makes a reality of unlimited free energy from the vacuum of the universe. The entire planet can be powered electrically without burning fuel of any sort. The underlying principles have already been demonstrated by the creation of more than a dozen types of successful hardware. I understand the Chinese are aware of the underlying science, but I certainly hope the United States will provide the solution first. I find your unique approach to problem solving exciting. I realize that free energy may work against your present source of revenue, but the full deployment of free energy will take a long time and there is plenty of money to be made with free energy to replace your present revenue.


is there any point joining in? Even sci.env tends to be less wacky than that!

2005-07-27

Woo-hoo MSU

Getting a bit desperate with the titles. My last post said the vn5.2 had gone again. For those who want to download the vn5.2 MSU, it seems to be at ftp://ghrc.nsstc.nasa.gov/pub/data/msu/t2lt/. It appears to be identical (says "diff") to the stuff I downloaded before (which is actually a teensy bit curious, because I had to strip off a small amount of header info before, and don't seem to need to now. Hey ho).

Is this a site that S+C have forgotten they uploaded stuff to? If so, it will be interesting to find out if they read this blog, because if it suddenly disappears, they do...

BTW, if you're interested in poking around in the history of a site, then you want the Internet Archive: http://web.archive.org/web/*/http://vortex.nsstc.uah.edu/.

Just to be sure, for those following the details, here is the directory listing, as of now (apologies to planets and so on):


Index of ftp://ghrc.nsstc.nasa.gov/pub/data/msu/t2lt/
Up to higher level directory
File: msu_dPRT_2.dat 8416 KB 2005-06-14 17:46:00
File: msudrift_2.dat 269 KB 2005-06-14 17:46:00
File: msudrift_2LT_fit.dat 1296 KB 2005-06-14 17:47:00
File: readme.20Aug2004 15 KB 2004-09-09 00:00:00
File: tltN06N07z5.1 420 KB 2005-06-14 17:47:00
File: tltN06N09z5.1 233 KB 2005-06-14 17:47:00
File: tltN07N08z5.1 263 KB 2005-06-14 17:47:00
File: tltN09N10z5.1 70 KB 2005-06-14 17:47:00
File: tltN10N11z5.1 685 KB 2005-06-14 17:47:00
File: tltN11N12z5.1 698 KB 2005-06-14 17:47:00
File: tltN12N14z5.1 911 KB 2005-06-14 17:47:00
File: tltN14N15z5.1 753 KB 2005-06-14 17:47:00
File: tltN15N16z5.1 643 KB 2005-06-14 17:47:00
File: tltTSNN06z5.1 120 KB 2005-06-14 17:47:00
File: tltday_5.1 340 KB 2005-06-14 17:47:00
File: tltdayac7998_5.1 16 KB 2005-06-14 17:47:00
File: tltdayacz7998_5.1 137 KB 2005-06-14 17:47:00
File: tltdayamz_5.1 3549 KB 2005-06-14 17:47:00
File: tltglhmam_5.1 25 KB 2005-06-14 17:47:00
File: tltmonacg_5.1 616 KB 2005-06-14 17:47:00
File: tltmonamg.1978_5.1 52 KB 2005-06-14 17:47:00
File: tltmonamg.1978_5.2 52 KB 2005-06-30 19:37:00
File: tltmonamg.1979_5.1 616 KB 2005-06-14 17:47:00
File: tltmonamg.1979_5.2 616 KB 2005-06-30 19:37:00
File: tltmonamg.1980_5.1 616 KB 2005-06-14 17:47:00
File: tltmonamg.1980_5.2 616 KB 2005-06-30 19:37:00
File: tltmonamg.1981_5.1 616 KB 2005-06-14 17:47:00
File: tltmonamg.1981_5.2 616 KB 2005-06-30 19:37:00
File: tltmonamg.1982_5.1 616 KB 2005-06-14 17:47:00
File: tltmonamg.1982_5.2 616 KB 2005-06-30 19:37:00
File: tltmonamg.1983_5.1 616 KB 2005-06-14 17:47:00
File: tltmonamg.1983_5.2 616 KB 2005-06-30 19:37:00
File: tltmonamg.1984_5.1 616 KB 2005-06-14 17:47:00
File: tltmonamg.1984_5.2 616 KB 2005-06-30 19:37:00
File: tltmonamg.1985_5.1 616 KB 2005-06-14 17:47:00
File: tltmonamg.1985_5.2 616 KB 2005-06-30 19:37:00
File: tltmonamg.1986_5.1 616 KB 2005-06-14 17:47:00
File: tltmonamg.1986_5.2 616 KB 2005-06-30 19:37:00
File: tltmonamg.1987_5.1 616 KB 2005-06-14 17:47:00
File: tltmonamg.1987_5.2 616 KB 2005-06-30 19:37:00
File: tltmonamg.1988_5.1 616 KB 2005-06-14 17:47:00
File: tltmonamg.1988_5.2 616 KB 2005-06-30 19:37:00
File: tltmonamg.1989_5.1 616 KB 2005-06-14 17:47:00
File: tltmonamg.1989_5.2 616 KB 2005-06-30 19:37:00
File: tltmonamg.1990_5.1 616 KB 2005-06-14 17:47:00
File: tltmonamg.1990_5.2 616 KB 2005-06-30 19:37:00
File: tltmonamg.1991_5.1 616 KB 2005-06-14 17:47:00
File: tltmonamg.1991_5.2 616 KB 2005-06-30 19:37:00
File: tltmonamg.1992_5.1 616 KB 2005-06-14 17:47:00
File: tltmonamg.1992_5.2 616 KB 2005-06-30 19:37:00
File: tltmonamg.1993_5.1 616 KB 2005-06-14 17:47:00
File: tltmonamg.1993_5.2 616 KB 2005-06-30 19:37:00
File: tltmonamg.1994_5.1 616 KB 2005-06-14 17:47:00
File: tltmonamg.1994_5.2 616 KB 2005-06-30 19:37:00
File: tltmonamg.1995_5.1 616 KB 2005-06-14 17:47:00
File: tltmonamg.1995_5.2 616 KB 2005-06-30 19:37:00
File: tltmonamg.1996_5.1 616 KB 2005-06-14 17:47:00
File: tltmonamg.1996_5.2 616 KB 2005-06-30 19:37:00
File: tltmonamg.1997_5.1 616 KB 2005-06-14 17:47:00
File: tltmonamg.1997_5.2 616 KB 2005-06-30 19:37:00
File: tltmonamg.1998_5.1 616 KB 2005-06-14 17:47:00
File: tltmonamg.1998_5.2 616 KB 2005-06-30 19:37:00
File: tltmonamg.1999_5.1 616 KB 2005-06-14 17:47:00
File: tltmonamg.1999_5.2 616 KB 2005-06-30 19:37:00
File: tltmonamg.2000_5.1 616 KB 2005-06-14 17:47:00
File: tltmonamg.2000_5.2 616 KB 2005-06-30 19:37:00
File: tltmonamg.2001_5.1 616 KB 2005-06-14 17:47:00
File: tltmonamg.2001_5.2 616 KB 2005-06-30 19:37:00
File: tltmonamg.2002_5.1 616 KB 2005-06-14 17:47:00
File: tltmonamg.2002_5.2 616 KB 2005-06-30 19:37:00
File: tltmonamg.2003_5.1 616 KB 2005-06-14 17:47:00
File: tltmonamg.2003_5.2 616 KB 2005-06-30 19:37:00
File: tltmonamg.2004_5.1 616 KB 2005-06-14 17:47:00
File: tltmonamg.2004_5.2 616 KB 2005-06-30 19:37:00
File: tltmonamg.2005_5.1 206 KB 2005-06-14 17:47:00
File: tltmonamg.2005_5.2 257 KB 2005-06-30 19:37:00
File: uahncdc.lt 50 KB 2005-06-14 17:47:00
File: usa48_LT.dat 4 KB 2005-06-14 17:47:00

MSU ping-pong. Or Yo-yo. Or some word denoting here-and-then-not-here.

What the f*ck are Spencer and Christy up to? First they put up vn5.2 MSU data, then they take it down again (the May and Jun maps have the multi-year trend on, so we know they have processed all the years. And anyway, we know they processed all the years because they put up the monthly data in early July, and I downloaded it, then they removed it again).

And last night, the amusingly-named "Atheist4bush" posted to sci.env:

Athiest 4 Bush                        at Close Enough for Government Work

Subject: They're ba-aack.

Newsgroups: sci.environment,alt.global-warming

UAH MSU TLT 5.2 that is:

http://vortex.nsstc.uah.edu/data/msu/t2lt/?C=M;O=A

WMC will you re-run your analysis?


You see, I have a reputation... [BTW, I faked in the subject line for clarity, the rest is accurate]. Leaving aside the question of just how A4B knew it (does he watch their site every day? Possible) I went and looked and sure enough, the vn5.2 data was there. Fine, I thought, I'll download it tomorrow, see if its the same as the last vn5.2. So today I look... and... its gone! Its almost but not quite enough to make me mail S+C and ask what is going on: but I won't, because its more fun writing annoyed posts :-)

Amusingly enough, you can tell that something was there-and-then-not-there, because of the timestamp on the directory itself (http://www.nsstc.uah.edu/public/msu/ - yes I know its not quite the same, I think they are all softlinked):


t2/ 30-Jun-2005 07:20 -
t2lt/ 27-Jul-2005 08:04 -
t4/ 30-Jun-2005 13:12 -


OTOH there is a file called MSU.tgz in there with a datestamp of 24 July. I wonder whats in it? Its 48M... perhaps it just a trap to waste bandwidth! I'm going to download it and see... be right back... Boooooooorrriiinggggg... its just a tar of the directory tree on the 24th, without the vn5.2 data.

[I've just noticed something a bit odd... the /public/msu/t2 dir has a datestamp of 30-Jun, but contains files with datestamps of 12-Jul-2005. Odd. I though a new file updated the dir timestamp. But my *nix may be a bit ropey on that. Anyone?]

2005-07-24

Harry Potter and the Polar Amplification of Global Warming

Yes at last some science again. The title is a forlorn attempt to draw in hordes of eager new readers... :-)

So... we all know that the poles are due to get warmer than the rest of the planet under global warming, but do we know why? Before answering why, I should point out that only the northern polar regions show general warming at present, and that this is exactly what the climate models "predict". This is generally (and I would say correctly) ascribed mostly to the moderating influence of the vast southern ocean. But it may also be partly because there is very little scope for ice-albedo feedback over Antarctica: its snow-covered now, and most of it will stay that way under any plausible warming. Unlike, say, bits of Siberia or Alaska, which (if you warm them a bit) will lose some seasonal snowcover. The only bit of "antarctica" which can participate in ice-albedo feedback is the seasonal sea ice; and this has only been measured well since 1979.

But on to the paper I wanted to blog: V A Alexeev et al, Climate Dynamics (2005) 24: 655-666. If you want the technical details, you can read the paper, so I'll assume that what you want is a superficial overview. If so, read on :-)

In fact, if you want a truely superficial overview, the answer is something like the sum of:


  1. Ice-albedo feedback
  2. Forcing in the tropics warms the globe. Forcing in the extra-tropics warms the extra-tropics only. Hence, global forcing warms the extra-tropics more.


In a bit more detail... they start off with a simple "Budyko-Sellers" type EBM (energy balance model):


d/dx D(1-x^2) d/dx T(x) = A + B T(x) - Q S(x) (1 - a(x))


with T the temperature, D the (latitudinal) diffusion coefficient, A and B are a linear param of OLR, Q is 1/4 the solar constant, S is a heating function and a(x) is the albedo. Tune up A and B and you have a a simple model. a(x) is simple too: a(x) = 0.3 is T > -10 oc and 0.6 otherwise (at least to start with; it gets enven simpler later). "T" is interpreted as annual and zonally averaged temperature, "x" is latitude.

So, fine: take the model, run it; then add something: 4 w/m2 to the RHS and look at the changes to T. And you discover... general warming (of course) and polar amplification of the warming (because the albedo, a, is T-dependent).

Well, this is what you wanted to see and built the model accordingly: an ice-albedo feedback is enough to give polar amplification. But by itself its a bit dull. So they modify the model to remove the T-dependent-albedo (ie, its now fixed) and they discover... no polar amplification. As expected. T rises uniformly. This too is dull.

But, aha! they say, the model is too simple, since we know that if the air is warmer there will be more moisture (notice carefully avoids saying the air will contain more moisture...) so the same winds will carry more energy polewards. So its fair to make the diffusion coefficient linearly dependent on the temperature, to rather crudely simulate that effect. And, ta-da, when you do that, you then recover the polar amplification. And if you split the forcing into tropics and not-tropics, you discover that the forcing flows out of the tropics polewards, but not so much from the extra-tropics tropics-wards. Which is about what you expect on flow-of-energy grounds.

However, it has sort-of been deliberately built in. So, instead, they do much the same thing in two different aqua-planet GCMs: turn off albedo changes, force in tropics only; force in extra-tropics only; and force globally. And that gives you polar amplification. And the global tends to be the sum of the other two (ie, its sort-of linear, with the albedo fixed). And looking at the GCM diags, the mechanism is apparently similar to the simple EBM case (actually the clouds help a bit too, but they get amplification even with the clouds fixed).

So we end up with: polar amplification is:


  1. Ice-albedo feedback
  2. Forcing in the tropics warms the globe. Forcing in the extra-tropics warms the extra-tropics only. Hence, global forcing warms the extra-tropics more.


Sadly they don't really tell you which influence is bigger in the real world. The thing that they don't mention, but folk often do, is the idea that the greenhouse effect of CO2 is bigger in the polar regions because its colder, hence less H2O, hence CO2 increases "can have a bigger effect". I don't think thats true, and they dont even bother mentioning it, so presumably they agree.

Stupidity (mine)

Two examples of stupidity, by me, follow. I just found them interesting... probably they are mostly failures of lateral thinking.

Before that: some misc. If you're interested, there's a photo of my apiary at the bee blog. And JA has a post about the next-generation Pork Barrel Simulator, though being polite he doesn't call it that. Am I being unfair? James also notes, about the "Great Tokyo Earthquake": Our own earthquake detection system rated last Saturday's quake as a plastic-man-toppler which I thought very cute. Speaking of the Simulator, I've just got hadcm3 running on a quad-opteron box under g95 at what looks like 2y/day. Sadly g95 is nothing like as good as gcc: its about 2-3 times slower than commercial fortran compilers, at least on some bits of the code.

OK, on to the stupidity. Number 1 is the shower. About 6 months ago, ours broke (in that it wouldn't really turn off). So I stuffed a cork in it, and we went on to having shallow baths. This was because it really wasn't worth getting a plumber in when the entire bathroom was being rebuilt... soon. We're getting closer to the soon (about 2 months away now). But, the point is, last weekend I bought for £6 one of those rubber things that you put over the bath taps so you can have a shower. Its less convenient (you have to take it off to fill the bath with any speed) BUT it does give you a decent shower. So why did it take me 6 months to think of buying one?

Number 2 is the sand pile. Not self-organised criticality thereof, but a simpler matter: the builders had left a big (1/2-tonne) bag of sand in the middle of the lawn. It made mowing the lawn a right pain etc etc and they were always about to get round to moving it. It was far to heavy for me to drag, though Ian-the-Architect thought a few people might move it. Anyway, in the end, when they were obliged to tidy up, Paul the Builder came along, and... just shovelled it from one bag into another. It took him less than 1/2 hour. I could have done that, had I thought to.

2005-07-23

Shoot to Kill?

A brief foray into politics... around the recent London bombings... which are becoming confusing...

"Shoot to kill" was a policy probably used in Northern Ireland by the security forces during the IRA times. It was always denied, but widely believed, that in many cases IRA-type terrorist suspects would be deliberately killed rather than apprehended where possible (the example that springs to mind was the Gibraltar incident). The wiki RUC page has a bit on this, if you're unfamiliar with it.

This may all seem a bit namby-pamby to American readers: the typical Brit imagines US police forces wasting suspects left right and center. But generally we like to think that don't do it over here. Unless the authorities get panicky, and in the wake of the second round of bombings that begins to look rather likely.

Wikipedia seems to have good articles on the 2005/07/7 and 2005/07/21 bombings. To my mind, the chief characteristic of the first was bloody success; and of the second, total failure. Which makes one suspect that different people done it (err, or rather, organised it, since obviously the first lot couldn't do it again...). At the moment, no-one knows. The other thing no-one knows is what the first lot of bombs were made of. I've seen the papers stating that they were high-grade military explosive; that they were home-made unstable "TATP"; and that the police commissioner has stated that they have no idea what they were made of. Presumably the police now know what the second lot were made of, since they didn't go off, but so far they're not telling the rest of us.

Anyway, back to shoot-to-kill: Police shot a man dead in London at Stockwell tube station shortly after 10:00 on 22 July who they believed had a connection to the 21 July bombings in London. He was reportedly of South Asian appearance. Eyewitnesses report that three plain-clothes police officers pursued another man onto a train. The suspect tripped while jumping on the train and one of the police officers shot him three or five times with a black handgun, killing him. They said that the man was wearing a large winter coat, despite it being summer. One eyewitness said he appeared to be wearing a bomb belt. Police later reported that the man was in fact not carrying explosives. There are conflicting reports as to whether the police attempted to restrain the man on the floor, and whether a verbal warning was given before the man was shot. Sir Ian Blair later said, in a press conference, that a warning was issued and that the air ambulance was called but the man was pronounced dead at the scene [1]. Thats not too surprising, since the other reports I've seen said he was shot five times in the head from point-blank range, and you'd do well to survive that. The speculation, of course, (or justification) for blowing him away was not to give him a chance to blow himself up. But... does that make sense? Because there are weasel words around the "warning" that Blair says was issued. Several bystanders reported no warning, and the Torygraph at least was quite happy with that, arguing that it was quite sensible to give no warning to a potential suicide bomber. And in fact it makes sense to me too. So why is Blair asserting that a warning was given (it could just be reflex)?

The police have now admitted he was innocent (well not quite that: they said): We are now satisfied that he was not connected with the incidents of Thursday 21st July 2005. For somebody to lose their life in such circumstances is a tragedy... which is also a bit weaselly, because he didn't carelessly "lose" his life he got blown away quite deliberately by the police. It would be nice if they could say "we're sorry we killed him".

And now a thought experiment: if you wanted to make your ethnic minorities distrust you and hate your police force and go off and join extremist organisations, what better method that to shoot some of them dead?

Meanwhile, some Italians are cancelling their football tour. Wimps. They are more likely to die on the plane over than by a bomb when they get here. Unless they wear overcoats in summer, of course, in which case the police will get them....

Meanwhile number 2, Explosion rocks Trinidad capital on the 11th. No-one seems to know what that one was about, though.

2005-07-21

MSU and Fu, revisited

I've recently been reading GEOPHYSICAL RESEARCH LETTERS, VOL. 32, L10703, doi:10.1029/2004GL022266, 2005 Satellite-derived vertical dependence of tropical tropospheric temperature trends by Qiang Fu and Celeste M. Johanson (and PDF here) in an effort to understand the differences between S+C's (==UAH) vn5.2 and vn5.1 temperature series - see previous here.

The F+J paper looks good, and is well worth reading (thanks to SC I think for pointing it out).

The paper basically says (looking at the tropics) that the S+C vn5.1 is wrong, and indeed physically implausible. They say 'the near-zero trend from Spencer and Christy’s MSU channel-2 angular scanning retrieval for the tropical low-middle troposphere (T2LT) is inconsistent with tropical tropospheric warming derived from their MSU T2 and T4 data. We show that the T2LT trend bias can be largely attributed to the periods when the satellites had large local equator crossing time drifts that cause large changes in calibration target temperatures and large diurnal drifts'.

F+J identify a jump in about 1992/3 in the UAH-RSS series, differencing the TLT (RSS) and 2LT (UAH) series. This looks similar to what I found (pic here) between UAH vn5.1 and vn5.2. So that suggests that S+C have indeed revised their version towards the RSS version.

But why? S+C aren't saying, so we have to guess.

F+J identify problems with intersatellite calibration, in particular the LECT drift, and NOAA-11. LECT is "local equator crossing time" which ideally would be fixed but in fact changes. However, the jump I see in 1992/3 fits better with NOAA-12. F+J do say 'The two jumps over land near 1992 and 1995 seem to be related to satellite transitions, respectively, from NOAA 10 to 12, and from NOAA 11 to 14'. And the 1992/3 jump does seem to fit the introduction of NOAA-12 quite well (see fig 4 of Correcting the MSU Middle Tropospheric Temperature for Diurnal Drifts Carl A. Mears, Matthias C. Schabel, and Frank J. Wentz).

But looking at individual months doesn't make things obvious... the jump is not to a continuous new level, though there are hints that the first 3 months of 1992,3,4 are rather different... but the pattern breaks in 1995. What is true is that 5.2-5.1 diffs are very very zonal. Interestingly, this says (of NOAA 11) 'The primary mission sensor, the AVHRR, failed on September 13, 1994. The satellite was placed in standby mode in March of 1995 and was reactivated to provide sounding data after a NOAA-12 sounder failure in May 1997'.

Hmm, well, interesting bits and pieces but not a full story.

Bees

I've finally decided that the best way to keep track of my beekeeping is to have a blog for it, and it is... http://williams-bees.blogspot.com/... if you're unwise enough to be interested!

Coming soon... Harry Potter and the MSU. I think.

2005-07-20

Hairy Pooter and the Half-Baked Premise

Sorry, that was the best mock-title I could think of. And despite it, I liked the book (despite a notable lack of fart jokes). Anyway, I thought I ought to join the ranks of bloggers posting that they have read it...

Warning: no spoilers at all ahead. You'll have to read it yourself.

So... its a bit shorter than the last (boooo!). The characters develope a bit, JKR's writing style has maybe advanced a bit, but who gives a toss about the literary theory type stuff, the important bit is staying up till after midnight to finish it, which I never did for Proust... Also my 7 year old son is pretty keen on it (in the midnight queue at Oxford to buy it, he was nose-deep in HPv desperate to finish it so he could get onto vi... its a strange madness). There are various twists and turns in the plot, some reasonable false leads and double-false leads; happily the quidditch gets downplayed, as she ran out of interesting things to say about it several books ago. Ditto the Dursleys. I couldn't see any obvious self-contradictory logical flaws (unlike GoF, which had a massive self-contradiction at its very heart). I liked Luna, but then I think I'm supposed to.

2005-07-14

Hurricanes...

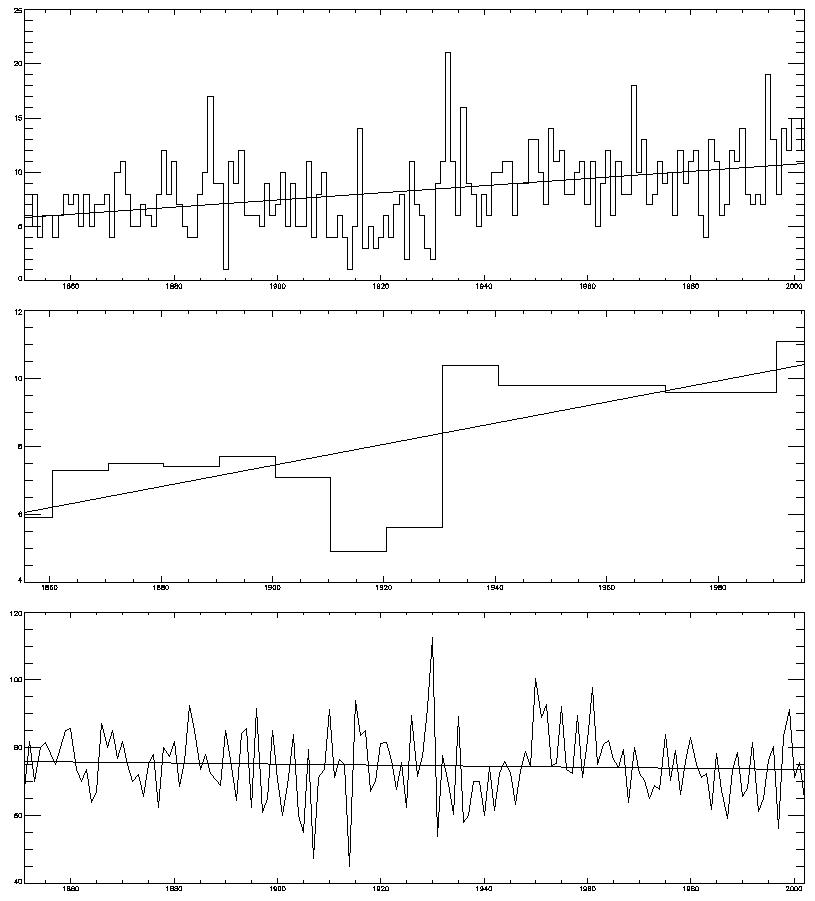
[This post updated, due to a couple of cock-ups... see the []'s and strikeout. First of all, there was an error in the 1851-1930 trend line drawn in the second pic (thanks to JA's eagle eye for this). Its corrected now - twas a bug in my software (for those interested, I needed to recalc the trends right at the end, but forgot to, so the before-break trend was always the last one calc, which is why it was so similar to the full trend). Remove the "1" from the png name to see the original.]


Landsea, Trenberth, Connolley... the list of famous scientists drawn irresistibly to draw trend lines through hurricane numbers grows. Anyway, this follows some recent stuf on sci.env. I found Atlantic Storms
sorted by Year (1851-2002)
, extracted the raw data, and plotted it. I have concerns though: it seems to me that there might be biases in missing early storms. And indeed if you look at the East Pacific page, it seems there are early biases that they warn you of. But they don't warn about the Atlantic numbers. So lets trust them, at least for these porpoises.

So we get the pair of three pics at the top: top pic is hurricane number by year, bottom is avg max wind speed for that year. There is a trend, increasing, for the top one (and my software says its stat sig); and clearly no trend for the bottom one.

[A word about stat sig: as two comments pointed out (thanks) I was being naive about the sig: you need to take autocorrelation of the data into account. I know this full well, but I was in a hurry. To do this, you can (a) do it properly (deflate the d.o.f.) or (b) try averaging the data for a longer period. Thats what the middle pic is: I've averaged it for 10 year periods, so the autocorr mostly disappears. And the trend stays sig now.]


But... if you look closely, it looks like there is a jump in numbers in 1920-1930 ish, perhaps? So, I ran it through my jump-detection software (Reference: Lund and Reeves, J Climate, p2547, 2002) and get... this pic. Top graph is the "is-there-a-jump" function, which intersects the line of 95% probability, so yes it thinks there is. Bottom graph is the softwares best guess at the jump point, and trend lines before and after assuming a discontinuity there. The software thinks the jump is between 1930 and 1931. The trend, from 1931 on, is not significant any more [and nor is the pre-1930 trend. Note that this *can* be trusted, even with autocorr: taking into account the corr would only make it even less sig]. Its interesting that the software picks up the jump that my eye (at least) does. And I *didn't* run the software first and then decide on a jump: I looked at it by eye, thought "hmm I wonder what the software sez" and lo!, we agree.

What, if anything, does this mean? Probably, not very much. You'd need to be far more careful about homogenising the data, and checking back to the sources, if you were to take this seriously. You might want to see what happened around 1930 to observing practices, ship movements, etc, around there. This is just for fun.

More on the MBH-Barton fight

Take a look at: http://www.aaas.org/news/releases/2005/0714letter.pdf. Good stuff! A lot better than von S.

[Update: oh great. I see Chris Mooney was there before me, but only by 2 hours. But does he have...]

Rumour: more stuff to come on sunday!

Building / Programming / Art

No science today, I've been a bit busy recently; also to Reading for a HiGEM meeting (where I gossiped about JA with MR...). So why not have a look at the state of our building work instead?

From the Grauniad, an interesting article about rent-a-coder.com, which appears to be a small-granularity outsourcing project. You've got a bit of code to write? Then you can post your problem, people bid, and if you can agree a price then it gets done. Sounds interesting. Sadly I can't think of a way to make it work for climate model code.

Finally, a brief foray into Art Theory. I was down the pub, talking to someone with a Slim Volume on the History of Art beside her. So I mentioned Prousts view, expounded in A l'ombre des jeunes filles en fleurs, that each (great) artists starts afresh; there is, effectively, no art history. And he contrasts that with science, which builds on the past; he insists that art does not. To which my friend replied, "nonsense". And who knows, she may be right?

2005-07-10

What do pornographers and climate modellers have in common?

Ha... knew that would draw you in. Sadly the post is mistitled, because the P I'm talking about is Rowan Pelling, and she is more os a porn-writer than a -grapher, since she is (or was, it seems she has resigned) editor of the Erotic Review.

Anyway, what we have in common is our view of the London bombing, becaause (after a long perusal of the Sunday Independent) she is the only commentator I can find with a view broadly comparable to mine. She writes:

Brave? No, just fatalistic. It was bound to happen - talk of doughty Londoners showing Blitz spirit in the face of terrorist outrage...


though the bit I wanted to quote is only available to subscribers. She doesn't do the probabalistic bit (which JA didn't like, though I still do) but otherwise says things fairly similar to me - at least, similar measured by the difference between us and most other comments.

2005-07-09

We did not waver then, we shall not flinch now...

Bombs in London, about 50 dead, which is sad. And we don't yet know who did it.

The main reaction seems to be "we are bloody but unbowed; we shall not let this affect our way of life". Comparisons to the Blitz and so on (my title is taken from, I think, Betty Boothroyd on the 10 o'clock news). All very splendid and stiff upper lip. But probably it *will* affect our way of life, because the govt will use it as an excuse for yet more law.

But... what I actually wanted to say is, I agree it won't much affect peoples everyday life, but for a very different reason, and the reason is, it doesn't much affect anyones chance of dying.

London has (population+commuters) about 7M people; with an average life expectancy of 70 years, 100K will die each year, or about 300 each day. So I think most people are capable of doing a very rough calculation (not a formal calc, but probably more intuitive) and deduce that the added risk from bombs is low. Which is why most people will go back to using the tube when it reopens, and travelling to work as normal. Its why, when I go to a meeting at Reading from Cambridge on monday, I'll be going on the train via London and underground (if its open). I won't be driving direct from Cambridge to Reading, both because it would be too inconvenient, and because the risk (from car accidents) would be much higher.

OTOH, suppose the risk from bombing were to significantly impact the risk-of-dying: say increase it by 10%. If we had a bomb every day killing 30 people, I don't think we'd be seeing quite so much of this bloody-but-unbowed stuff. And it certainly would affect our way of life, because they would have to permanently shut the tube, and that would cause chaos.

2005-07-08

Reading the Runes, part III: the G8 statement

Yet more bl**dy runes. And I haven't even done von S over at P yet. They're piling up.

A word about this runes nonsense: if you want to know what the science says, you just read the science. It takes a bit of effort, but you get the information, properly references and presented. Go look at the IPCC TAR WGI report for example. But with politicians (err, and other stuff) I'm trying to guess whats in their mind, and more critically what position they are obliged to accept, given what they have said. Its quite fun, but not necessarily productive; although what they intend to do is likely related to what they say (in the case of politicians, they don't say things just because they are true, but to let you know what they are thinking or what they feel obliged to say). So none of this says anything useful about the science, of course.

The G8 statement appears to be at http://www.number-10.gov.uk/output/Page7881.asp.

What I'll try to do, for fun, is to attempt to cut out the goo, dribble and ambiguity out of their statement and see whats left (remember Founcdation?), and put my comments in [brackets].

1. We face serious and linked challenges in tackling climate change, promoting clean energy and achieving sustainable development globally. [Hmm... climate change is a serious challenge... does this mean much? If it did mean something, it would be supported by some detail. Lets see...]

(a) Climate change is a serious and long-term challenge that has the potential to affect every part of the globe. We know that increased need and use of energy from fossil fuels, and other human activities, contribute in large part to increases in greenhouse gases associated with the warming of our Earth's surface. [This is an idiot cunning attempt to write a sentence that *looks* like its saying we're contributing in large part to T rise, whilst in fact only saying that we're contributing in large part to GHG's. The latter is wrong (we're responsible for more than 100% of the atmos CO2 rise, not just a "large part"). "Associated with warming" is very vague]. While uncertainties remain in our understanding of climate science, we know enough to act now to put ourselves on a path to slow and, as the science justifies, stop and then reverse the growth of greenhouse gases. [Puffing uncertainty, otherwise vague].

(b) Global energy demands are expected to grow by 60% over the next 25 years. This has the potential to cause a significant increase in greenhouse gas emissions associated with climate change. [At last, some quantification, though only of the bits we knew about already. Boring]

4. We reaffirm our commitment to the UNFCCC and to its ultimate objective to stabilise greenhouse gas concentrations in the atmosphere at a level that prevents dangerous anthropogenic interference with the climate system. We reaffirm the importance of the work of the Intergovernmental Panel on Climate Change and look forward to its 2007 report. [Weak; dangerous is meaningless without some measure of the level; affirming the importance of the IPCC is nice but some congrats on its quality would have been better]

7. Adaptation to the effects of climate change due to both natural and human factors is a high priority for all nations... [This just about means something, in that if its a high priority it presumably implies that cliamte change is going to be a problem].

14. We acknowledge that the UNFCCC is the appropriate forum for negotiating future action on climate change. Those of us who have ratified the Kyoto Protocol welcome its entry into force and will work to make it a success. [The Italians have been getting wobbly on Kyoto; if they've signed this, maybe they've unwobbled a bit]

Overall: very weak. Probably means that nothing significant will be done & no policy changes are in prospect.

2005-07-07

House of Lords subverted by skeptics...

The House of Lords Select Committee on Economic Affairs has produced a report on The Economics of Climate Change (pdf). Initial impressions of it are poor. It fails to understand the distinctions between the different IPCC working groups. Being economic folk, they keep saying things like We welcome this recognition of the central role of economics in big bold letters. And they say The Committee decided to restrict the scope of its investigation to certain aspects of the economics of climate change. But... they are lying. Because they decided to talk nonsense about the Great Hockey Stick debate. They manage to say: We sought evidence that refuted the claims of McIntyre and McKitrick, but have not come across any detailed rebuttal. But this is where they have degenerated into bald-faced lying. Because had they contacted Mann (clearly they didn't) he would have pointed them to such. For heavens sake, its on the web at RC: Dummies guide to the latest “Hockey Stick” controversy has some info and links. But they do seem to have noticed that One curious feature of the debate over Professor Mann’s time series is that the critics appear to ignore other studies which secure similar hockey stick pictures..

There is a weird bit (para 15), possibly somewhat garbled, that indicates that Lindzen is still pushing nonsense: In the view of Professor Richard Lindzen of MIT, current climate models would have predicted a substantially greater increase in the past temperature than has been observed in the past 150 years, perhaps +3oC compared to the +0.6oC we have witnessed.. Err... but (as the report then goes on to point out) GCMs actually replicate the T record since 1860 pretty well (SPM, fig 4). Presumably what Lindzen is trying to say is that if you omit important forcings, you get the wrong answer, but this is bleedin' obvious. And where he gets 3oC from is a mystery.

Later on they manage to say: apparent divergences between land-based temperature records and satellite-based measurements, the latter showing some cooling rather than warming in recent years...? Unless they want people to wipe their bottoms on their shiny new report, they're going to have to do better than this.

They are on firmer ground - or so one might have hoped - on emissions scenarios/SRES (para 52 and on). Unfortunately they strongly overweight the value of Castles and Henderson, and they manage to wurble stupidly about the probablility of the various scenarios. But really... if they're decent economists, why don't the stop p*ss*ng around and just generate their own more reasonable scenario? Why haven't C+H? And... after all their ranting about MER/PPP, it makes hardly any difference (table 3).

After this there is a long bit on impacts/economics, that I skipped.

Then they get onto the traditional bit about how the "Summary for Policymakers" sections are written. Personally, I think it would be excellent if the US and Saudi govt's weren't allow to b*gg*r about with those bits, but sadly its all written down in the IPCC constitution that the SPMs are agreed line by line by govts, and I rather doubt that it will change. All of that section looks to me like its slanted with anti-IPCC bias, BTW. Well, most of the report does. Not so much the facts, but the tone.

Despite my professed desire to learn more about impacts, I got bored at this point, because clearly this isn't the place to learn from. Hey ho.