Here are some pics:
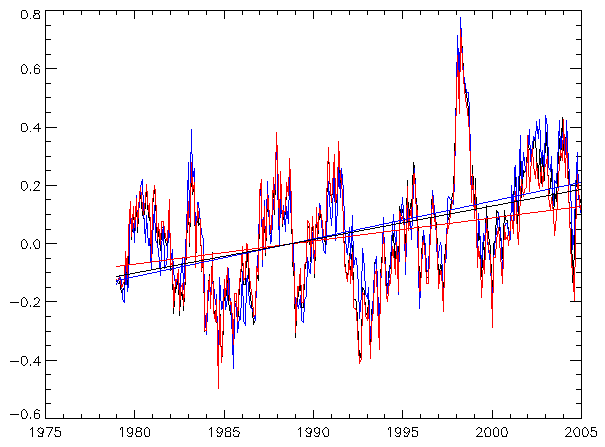
The black is the 5.2 series; the red is the 5.1; the blue is RSS. Trend lines are drawn on.
That pic is a bit hard to read: you might find:
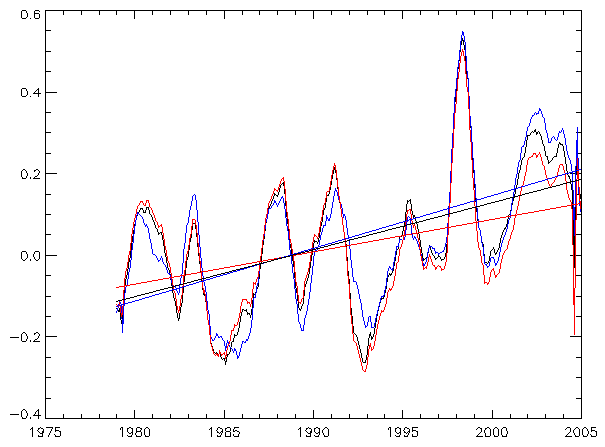
a bit easier. That is an 11-month running mean to remove some of the wiggles (except at the end points...). Some interesting features appear in that, which are clearer in a difference plot:
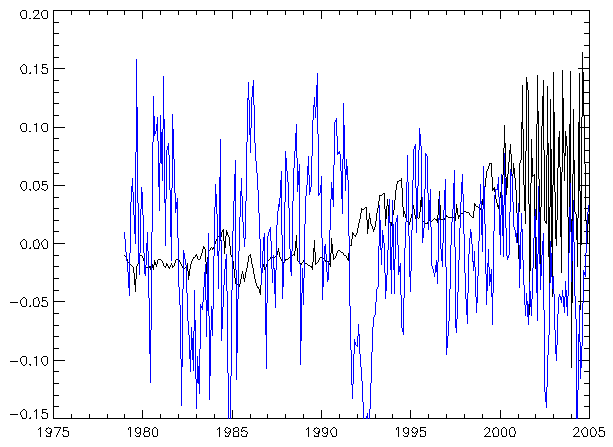
Black is now S+C 5.2-5.1; blue is 5.2-RSS (and the RSS is vn2.1, I think).
So... there is a jump between 5.2/5.1 around 1992/3 (who knows when the satellites changed?); and it goes all wiggly after 2001. Interesting.
Well, there you are. Don't get too excited because I by no means guarantee that this is (a) correct or (b) that the 5.2 files are indeed the correction that S+C promised. Time will tell.
10 comments:
The S+C data, if accurate, shows nearly 20 years of little evidence of change, followed by 10 years of substantial warming. Is that close enough to what climate models predict that it could be called a confirmation of the models?
It also seems to be divergent from surface observations. Is it possible that both surface obs and S+C are right, or are the atmospheric levels they measure so close that one of the two must be wrong?
Thanks for the post (and any answers to my questions)!
No self-respecting time series analyst would fit straight lines to those data and pretend that the lines meant anything!
Dear anon, I'm sorry to hear you being so disrespectful of Spencer and Christy, who (of course) have calculated the trends from their data, just like I did. You're wrong, of course: given a time series, you can fit a straight line and discover if its stat sig. This one is (ognoring autocorr).
Brian: Its a 25y record not 30! It shows lots of wiggles, and during some phases you could draw some lines through the wiggles. Read the next post, and you'll see what the trends look like if you start at the beginning and continue to year_x.
The S+C vn5.2 record does still diverge from the sfc (not sure how much: must plot them together some time). Possible explanations are: one or both are wrong; or that sfc and mid-troposphere can be decoupled (follow the RSS link next post to a piccy of the weighting functions). The sfc and the trop *could* be decoupled over decadal timescales... but AFAIK the models tend not to show this. Not that I've ever looked myself... another thing to check perhaps.
Thanks for your reasonable questions.
Update: I've realised that I did a plot of the RSS and sfc data at: http://en.wikipedia.org/wiki/Image:Rss-msu-annual-1979-2004-etc.png that might help.
>Belette said...
> Dear anon, I'm sorry to hear you being so disrespectful of Spencer and Christy, who (of course) have calculated the trends from their data, just like I did. You're wrong, of course: given a time series, you can fit a straight line and discover if its stat sig. This one is (ognoring autocorr).
How about showing some simple respect for freshman statistics? You can calculate anything you like, but only a fool would pretend it meant something. Can you spell outlier? And if you want to get a bit more advanced, trying spelling leverage, non-normality and nonlinearity.
Dear anon: I suggest you go and tell Spencer and Christy that they are fools, because the 0.12 oC/decade value comes from them.
...out of curiousity, who won the bet?
Me of course... JA wimped out of the hard work of doing the averaging... http://julesandjames.blogspot.com/2005/07/now-you-see-it-now-you-dont.html
You posted that you got a decadal trend of .116
http://vortex.nsstc.uah.edu/data/msu/t2lt/tltglhmam_5.2
says .123
Does this mean the race is back on?
From: Phil Jones
To: John Christy
Subject: This and that
Date: Tue Jul 5 15:51:55 2005
John,
There has been some email traffic in the last few days to a week - quite
a bit really, only a small part about MSU. The main part has been one of
your House subcommittees wanting Mike Mann and others and IPCC
to respond on how they produced their reconstructions and how IPCC
produced their report.
In case you want to look at this see later in the email !
Also this load of rubbish !
This is from an Australian at BMRC (not Neville Nicholls). It began from the attached
article. What an idiot. The scientific community would come down on me in no
uncertain terms if I said the world had cooled from 1998. OK it has but it is only
7 years of data and it isn't statistically significant.
The Australian also alerted me to this blogging ! I think this is the term ! Luckily
I don't live in Australia.
[1]http://mustelid.blogspot.com/2005/06/first-look-at-scs-msu-vn52.html
Unlike the UK, the public in Australia is very very na
Post a Comment