I've recently been reading GEOPHYSICAL RESEARCH LETTERS, VOL. 32, L10703, doi:10.1029/2004GL022266, 2005 Satellite-derived vertical dependence of tropical tropospheric temperature trends by Qiang Fu and Celeste M. Johanson (and PDF here) in an effort to understand the differences between S+C's (==UAH) vn5.2 and vn5.1 temperature series - see previous here.
The F+J paper looks good, and is well worth reading (thanks to SC I think for pointing it out).
The paper basically says (looking at the tropics) that the S+C vn5.1 is wrong, and indeed physically implausible. They say 'the near-zero trend from Spencer and Christy’s MSU channel-2 angular scanning retrieval for the tropical low-middle troposphere (T2LT) is inconsistent with tropical tropospheric warming derived from their MSU T2 and T4 data. We show that the T2LT trend bias can be largely attributed to the periods when the satellites had large local equator crossing time drifts that cause large changes in calibration target temperatures and large diurnal drifts'.
F+J identify a jump in about 1992/3 in the UAH-RSS series, differencing the TLT (RSS) and 2LT (UAH) series. This looks similar to what I found (pic here) between UAH vn5.1 and vn5.2. So that suggests that S+C have indeed revised their version towards the RSS version.
But why? S+C aren't saying, so we have to guess.
F+J identify problems with intersatellite calibration, in particular the LECT drift, and NOAA-11. LECT is "local equator crossing time" which ideally would be fixed but in fact changes. However, the jump I see in 1992/3 fits better with NOAA-12. F+J do say 'The two jumps over land near 1992 and 1995 seem to be related to satellite transitions, respectively, from NOAA 10 to 12, and from NOAA 11 to 14'. And the 1992/3 jump does seem to fit the introduction of NOAA-12 quite well (see fig 4 of Correcting the MSU Middle Tropospheric Temperature for Diurnal Drifts Carl A. Mears, Matthias C. Schabel, and Frank J. Wentz).
But looking at individual months doesn't make things obvious... the jump is not to a continuous new level, though there are hints that the first 3 months of 1992,3,4 are rather different... but the pattern breaks in 1995. What is true is that 5.2-5.1 diffs are very very zonal. Interestingly, this says (of NOAA 11) 'The primary mission sensor, the AVHRR, failed on September 13, 1994. The satellite was placed in standby mode in March of 1995 and was reactivated to provide sounding data after a NOAA-12 sounder failure in May 1997'.
Hmm, well, interesting bits and pieces but not a full story.
2005-07-21


Bees
I've finally decided that the best way to keep track of my beekeeping is to have a blog for it, and it is... http://williams-bees.blogspot.com/... if you're unwise enough to be interested!
Coming soon... Harry Potter and the MSU. I think.
Coming soon... Harry Potter and the MSU. I think.
2005-07-20
Hairy Pooter and the Half-Baked Premise
Sorry, that was the best mock-title I could think of. And despite it, I liked the book (despite a notable lack of fart jokes). Anyway, I thought I ought to join the ranks of bloggers posting that they have read it...
Warning: no spoilers at all ahead. You'll have to read it yourself.
So... its a bit shorter than the last (boooo!). The characters develope a bit, JKR's writing style has maybe advanced a bit, but who gives a toss about the literary theory type stuff, the important bit is staying up till after midnight to finish it, which I never did for Proust... Also my 7 year old son is pretty keen on it (in the midnight queue at Oxford to buy it, he was nose-deep in HPv desperate to finish it so he could get onto vi... its a strange madness). There are various twists and turns in the plot, some reasonable false leads and double-false leads; happily the quidditch gets downplayed, as she ran out of interesting things to say about it several books ago. Ditto the Dursleys. I couldn't see any obvious self-contradictory logical flaws (unlike GoF, which had a massive self-contradiction at its very heart). I liked Luna, but then I think I'm supposed to.
Warning: no spoilers at all ahead. You'll have to read it yourself.
So... its a bit shorter than the last (boooo!). The characters develope a bit, JKR's writing style has maybe advanced a bit, but who gives a toss about the literary theory type stuff, the important bit is staying up till after midnight to finish it, which I never did for Proust... Also my 7 year old son is pretty keen on it (in the midnight queue at Oxford to buy it, he was nose-deep in HPv desperate to finish it so he could get onto vi... its a strange madness). There are various twists and turns in the plot, some reasonable false leads and double-false leads; happily the quidditch gets downplayed, as she ran out of interesting things to say about it several books ago. Ditto the Dursleys. I couldn't see any obvious self-contradictory logical flaws (unlike GoF, which had a massive self-contradiction at its very heart). I liked Luna, but then I think I'm supposed to.
2005-07-14
Hurricanes...
[This post updated, due to a couple of cock-ups... see the []'s and strikeout. First of all, there was an error in the 1851-1930 trend line drawn in the second pic (thanks to JA's eagle eye for this). Its corrected now - twas a bug in my software (for those interested, I needed to recalc the trends right at the end, but forgot to, so the before-break trend was always the last one calc, which is why it was so similar to the full trend). Remove the "1" from the png name to see the original.]

Landsea, Trenberth, Connolley... the list of famous scientists drawn irresistibly to draw trend lines through hurricane numbers grows. Anyway, this follows some recent stuf on sci.env. I found Atlantic Storms
sorted by Year (1851-2002), extracted the raw data, and plotted it. I have concerns though: it seems to me that there might be biases in missing early storms. And indeed if you look at the East Pacific page, it seems there are early biases that they warn you of. But they don't warn about the Atlantic numbers. So lets trust them, at least for these porpoises.
So we get thepair of three pics at the top: top pic is hurricane number by year, bottom is avg max wind speed for that year. There is a trend, increasing, for the top one (and my software says its stat sig); and clearly no trend for the bottom one.
[A word about stat sig: as two comments pointed out (thanks) I was being naive about the sig: you need to take autocorrelation of the data into account. I know this full well, but I was in a hurry. To do this, you can (a) do it properly (deflate the d.o.f.) or (b) try averaging the data for a longer period. Thats what the middle pic is: I've averaged it for 10 year periods, so the autocorr mostly disappears. And the trend stays sig now.]

But... if you look closely, it looks like there is a jump in numbers in 1920-1930 ish, perhaps? So, I ran it through my jump-detection software (Reference: Lund and Reeves, J Climate, p2547, 2002) and get... this pic. Top graph is the "is-there-a-jump" function, which intersects the line of 95% probability, so yes it thinks there is. Bottom graph is the softwares best guess at the jump point, and trend lines before and after assuming a discontinuity there. The software thinks the jump is between 1930 and 1931. The trend, from 1931 on, is not significant any more [and nor is the pre-1930 trend. Note that this *can* be trusted, even with autocorr: taking into account the corr would only make it even less sig]. Its interesting that the software picks up the jump that my eye (at least) does. And I *didn't* run the software first and then decide on a jump: I looked at it by eye, thought "hmm I wonder what the software sez" and lo!, we agree.
What, if anything, does this mean? Probably, not very much. You'd need to be far more careful about homogenising the data, and checking back to the sources, if you were to take this seriously. You might want to see what happened around 1930 to observing practices, ship movements, etc, around there. This is just for fun.
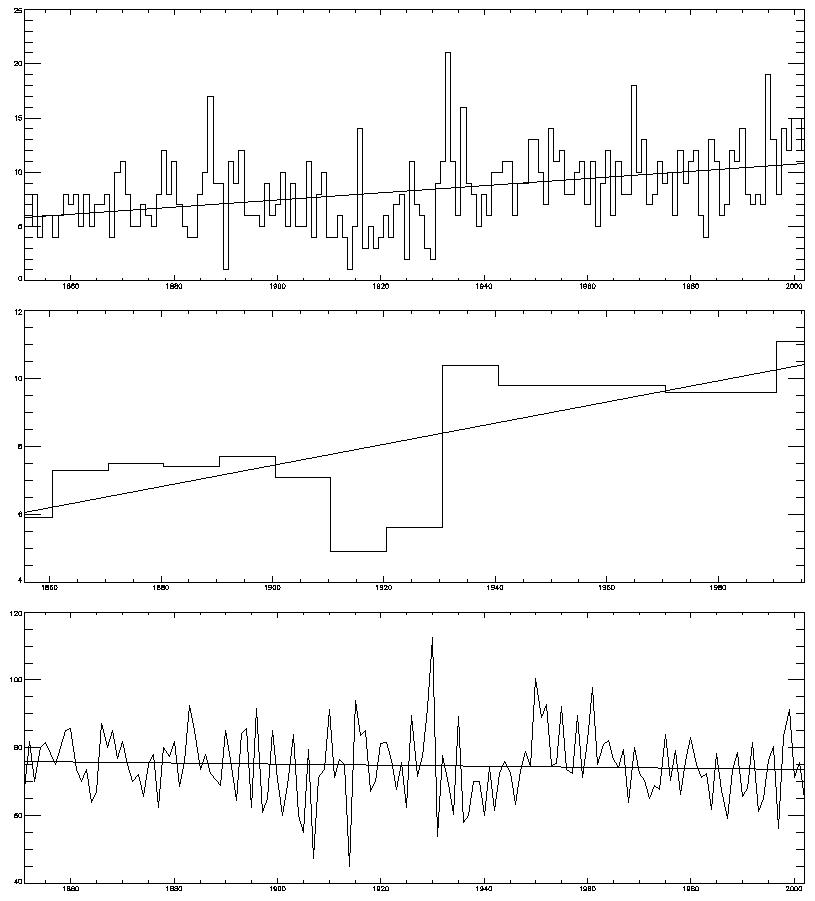
Landsea, Trenberth, Connolley... the list of famous scientists drawn irresistibly to draw trend lines through hurricane numbers grows. Anyway, this follows some recent stuf on sci.env. I found Atlantic Storms
sorted by Year (1851-2002), extracted the raw data, and plotted it. I have concerns though: it seems to me that there might be biases in missing early storms. And indeed if you look at the East Pacific page, it seems there are early biases that they warn you of. But they don't warn about the Atlantic numbers. So lets trust them, at least for these porpoises.
So we get the
[A word about stat sig: as two comments pointed out (thanks) I was being naive about the sig: you need to take autocorrelation of the data into account. I know this full well, but I was in a hurry. To do this, you can (a) do it properly (deflate the d.o.f.) or (b) try averaging the data for a longer period. Thats what the middle pic is: I've averaged it for 10 year periods, so the autocorr mostly disappears. And the trend stays sig now.]

But... if you look closely, it looks like there is a jump in numbers in 1920-1930 ish, perhaps? So, I ran it through my jump-detection software (Reference: Lund and Reeves, J Climate, p2547, 2002) and get... this pic. Top graph is the "is-there-a-jump" function, which intersects the line of 95% probability, so yes it thinks there is. Bottom graph is the softwares best guess at the jump point, and trend lines before and after assuming a discontinuity there. The software thinks the jump is between 1930 and 1931. The trend, from 1931 on, is not significant any more [and nor is the pre-1930 trend. Note that this *can* be trusted, even with autocorr: taking into account the corr would only make it even less sig]. Its interesting that the software picks up the jump that my eye (at least) does. And I *didn't* run the software first and then decide on a jump: I looked at it by eye, thought "hmm I wonder what the software sez" and lo!, we agree.
What, if anything, does this mean? Probably, not very much. You'd need to be far more careful about homogenising the data, and checking back to the sources, if you were to take this seriously. You might want to see what happened around 1930 to observing practices, ship movements, etc, around there. This is just for fun.
More on the MBH-Barton fight
Take a look at: http://www.aaas.org/news/releases/2005/0714letter.pdf. Good stuff! A lot better than von S.
[Update: oh great. I see Chris Mooney was there before me, but only by 2 hours. But does he have...]
Rumour: more stuff to come on sunday!
[Update: oh great. I see Chris Mooney was there before me, but only by 2 hours. But does he have...]
Rumour: more stuff to come on sunday!
Building / Programming / Art
No science today, I've been a bit busy recently; also to Reading for a HiGEM meeting (where I gossiped about JA with MR...). So why not have a look at the state of our building work instead?
From the Grauniad, an interesting article about rent-a-coder.com, which appears to be a small-granularity outsourcing project. You've got a bit of code to write? Then you can post your problem, people bid, and if you can agree a price then it gets done. Sounds interesting. Sadly I can't think of a way to make it work for climate model code.
Finally, a brief foray into Art Theory. I was down the pub, talking to someone with a Slim Volume on the History of Art beside her. So I mentioned Prousts view, expounded in A l'ombre des jeunes filles en fleurs, that each (great) artists starts afresh; there is, effectively, no art history. And he contrasts that with science, which builds on the past; he insists that art does not. To which my friend replied, "nonsense". And who knows, she may be right?
From the Grauniad, an interesting article about rent-a-coder.com, which appears to be a small-granularity outsourcing project. You've got a bit of code to write? Then you can post your problem, people bid, and if you can agree a price then it gets done. Sounds interesting. Sadly I can't think of a way to make it work for climate model code.
Finally, a brief foray into Art Theory. I was down the pub, talking to someone with a Slim Volume on the History of Art beside her. So I mentioned Prousts view, expounded in A l'ombre des jeunes filles en fleurs, that each (great) artists starts afresh; there is, effectively, no art history. And he contrasts that with science, which builds on the past; he insists that art does not. To which my friend replied, "nonsense". And who knows, she may be right?
2005-07-10
What do pornographers and climate modellers have in common?
Ha... knew that would draw you in. Sadly the post is mistitled, because the P I'm talking about is Rowan Pelling, and she is more os a porn-writer than a -grapher, since she is (or was, it seems she has resigned) editor of the Erotic Review.
Anyway, what we have in common is our view of the London bombing, becaause (after a long perusal of the Sunday Independent) she is the only commentator I can find with a view broadly comparable to mine. She writes:
though the bit I wanted to quote is only available to subscribers. She doesn't do the probabalistic bit (which JA didn't like, though I still do) but otherwise says things fairly similar to me - at least, similar measured by the difference between us and most other comments.
Anyway, what we have in common is our view of the London bombing, becaause (after a long perusal of the Sunday Independent) she is the only commentator I can find with a view broadly comparable to mine. She writes:
Brave? No, just fatalistic. It was bound to happen - talk of doughty Londoners showing Blitz spirit in the face of terrorist outrage...
though the bit I wanted to quote is only available to subscribers. She doesn't do the probabalistic bit (which JA didn't like, though I still do) but otherwise says things fairly similar to me - at least, similar measured by the difference between us and most other comments.
2005-07-09
We did not waver then, we shall not flinch now...
Bombs in London, about 50 dead, which is sad. And we don't yet know who did it.
The main reaction seems to be "we are bloody but unbowed; we shall not let this affect our way of life". Comparisons to the Blitz and so on (my title is taken from, I think, Betty Boothroyd on the 10 o'clock news). All very splendid and stiff upper lip. But probably it *will* affect our way of life, because the govt will use it as an excuse for yet more law.
But... what I actually wanted to say is, I agree it won't much affect peoples everyday life, but for a very different reason, and the reason is, it doesn't much affect anyones chance of dying.
London has (population+commuters) about 7M people; with an average life expectancy of 70 years, 100K will die each year, or about 300 each day. So I think most people are capable of doing a very rough calculation (not a formal calc, but probably more intuitive) and deduce that the added risk from bombs is low. Which is why most people will go back to using the tube when it reopens, and travelling to work as normal. Its why, when I go to a meeting at Reading from Cambridge on monday, I'll be going on the train via London and underground (if its open). I won't be driving direct from Cambridge to Reading, both because it would be too inconvenient, and because the risk (from car accidents) would be much higher.
OTOH, suppose the risk from bombing were to significantly impact the risk-of-dying: say increase it by 10%. If we had a bomb every day killing 30 people, I don't think we'd be seeing quite so much of this bloody-but-unbowed stuff. And it certainly would affect our way of life, because they would have to permanently shut the tube, and that would cause chaos.
The main reaction seems to be "we are bloody but unbowed; we shall not let this affect our way of life". Comparisons to the Blitz and so on (my title is taken from, I think, Betty Boothroyd on the 10 o'clock news). All very splendid and stiff upper lip. But probably it *will* affect our way of life, because the govt will use it as an excuse for yet more law.
But... what I actually wanted to say is, I agree it won't much affect peoples everyday life, but for a very different reason, and the reason is, it doesn't much affect anyones chance of dying.
London has (population+commuters) about 7M people; with an average life expectancy of 70 years, 100K will die each year, or about 300 each day. So I think most people are capable of doing a very rough calculation (not a formal calc, but probably more intuitive) and deduce that the added risk from bombs is low. Which is why most people will go back to using the tube when it reopens, and travelling to work as normal. Its why, when I go to a meeting at Reading from Cambridge on monday, I'll be going on the train via London and underground (if its open). I won't be driving direct from Cambridge to Reading, both because it would be too inconvenient, and because the risk (from car accidents) would be much higher.
OTOH, suppose the risk from bombing were to significantly impact the risk-of-dying: say increase it by 10%. If we had a bomb every day killing 30 people, I don't think we'd be seeing quite so much of this bloody-but-unbowed stuff. And it certainly would affect our way of life, because they would have to permanently shut the tube, and that would cause chaos.
2005-07-08
Reading the Runes, part III: the G8 statement
Yet more bl**dy runes. And I haven't even done von S over at P yet. They're piling up.
A word about this runes nonsense: if you want to know what the science says, you just read the science. It takes a bit of effort, but you get the information, properly references and presented. Go look at the IPCC TAR WGI report for example. But with politicians (err, and other stuff) I'm trying to guess whats in their mind, and more critically what position they are obliged to accept, given what they have said. Its quite fun, but not necessarily productive; although what they intend to do is likely related to what they say (in the case of politicians, they don't say things just because they are true, but to let you know what they are thinking or what they feel obliged to say). So none of this says anything useful about the science, of course.
The G8 statement appears to be at http://www.number-10.gov.uk/output/Page7881.asp.
What I'll try to do, for fun, is to attempt to cut out the goo, dribble and ambiguity out of their statement and see whats left (remember Founcdation?), and put my comments in [brackets].
1. We face serious and linked challenges in tackling climate change, promoting clean energy and achieving sustainable development globally. [Hmm... climate change is a serious challenge... does this mean much? If it did mean something, it would be supported by some detail. Lets see...]
(a) Climate change is a serious and long-term challenge that has the potential to affect every part of the globe. We know that increased need and use of energy from fossil fuels, and other human activities, contribute in large part to increases in greenhouse gases associated with the warming of our Earth's surface. [This is an idiot cunning attempt to write a sentence that *looks* like its saying we're contributing in large part to T rise, whilst in fact only saying that we're contributing in large part to GHG's. The latter is wrong (we're responsible for more than 100% of the atmos CO2 rise, not just a "large part"). "Associated with warming" is very vague]. While uncertainties remain in our understanding of climate science, we know enough to act now to put ourselves on a path to slow and, as the science justifies, stop and then reverse the growth of greenhouse gases. [Puffing uncertainty, otherwise vague].
(b) Global energy demands are expected to grow by 60% over the next 25 years. This has the potential to cause a significant increase in greenhouse gas emissions associated with climate change. [At last, some quantification, though only of the bits we knew about already. Boring]
4. We reaffirm our commitment to the UNFCCC and to its ultimate objective to stabilise greenhouse gas concentrations in the atmosphere at a level that prevents dangerous anthropogenic interference with the climate system. We reaffirm the importance of the work of the Intergovernmental Panel on Climate Change and look forward to its 2007 report. [Weak; dangerous is meaningless without some measure of the level; affirming the importance of the IPCC is nice but some congrats on its quality would have been better]
7. Adaptation to the effects of climate change due to both natural and human factors is a high priority for all nations... [This just about means something, in that if its a high priority it presumably implies that cliamte change is going to be a problem].
14. We acknowledge that the UNFCCC is the appropriate forum for negotiating future action on climate change. Those of us who have ratified the Kyoto Protocol welcome its entry into force and will work to make it a success. [The Italians have been getting wobbly on Kyoto; if they've signed this, maybe they've unwobbled a bit]
Overall: very weak. Probably means that nothing significant will be done & no policy changes are in prospect.
A word about this runes nonsense: if you want to know what the science says, you just read the science. It takes a bit of effort, but you get the information, properly references and presented. Go look at the IPCC TAR WGI report for example. But with politicians (err, and other stuff) I'm trying to guess whats in their mind, and more critically what position they are obliged to accept, given what they have said. Its quite fun, but not necessarily productive; although what they intend to do is likely related to what they say (in the case of politicians, they don't say things just because they are true, but to let you know what they are thinking or what they feel obliged to say). So none of this says anything useful about the science, of course.
The G8 statement appears to be at http://www.number-10.gov.uk/output/Page7881.asp.
What I'll try to do, for fun, is to attempt to cut out the goo, dribble and ambiguity out of their statement and see whats left (remember Founcdation?), and put my comments in [brackets].
1. We face serious and linked challenges in tackling climate change, promoting clean energy and achieving sustainable development globally. [Hmm... climate change is a serious challenge... does this mean much? If it did mean something, it would be supported by some detail. Lets see...]
(a) Climate change is a serious and long-term challenge that has the potential to affect every part of the globe. We know that increased need and use of energy from fossil fuels, and other human activities, contribute in large part to increases in greenhouse gases associated with the warming of our Earth's surface. [This is an idiot cunning attempt to write a sentence that *looks* like its saying we're contributing in large part to T rise, whilst in fact only saying that we're contributing in large part to GHG's. The latter is wrong (we're responsible for more than 100% of the atmos CO2 rise, not just a "large part"). "Associated with warming" is very vague]. While uncertainties remain in our understanding of climate science, we know enough to act now to put ourselves on a path to slow and, as the science justifies, stop and then reverse the growth of greenhouse gases. [Puffing uncertainty, otherwise vague].
(b) Global energy demands are expected to grow by 60% over the next 25 years. This has the potential to cause a significant increase in greenhouse gas emissions associated with climate change. [At last, some quantification, though only of the bits we knew about already. Boring]
4. We reaffirm our commitment to the UNFCCC and to its ultimate objective to stabilise greenhouse gas concentrations in the atmosphere at a level that prevents dangerous anthropogenic interference with the climate system. We reaffirm the importance of the work of the Intergovernmental Panel on Climate Change and look forward to its 2007 report. [Weak; dangerous is meaningless without some measure of the level; affirming the importance of the IPCC is nice but some congrats on its quality would have been better]
7. Adaptation to the effects of climate change due to both natural and human factors is a high priority for all nations... [This just about means something, in that if its a high priority it presumably implies that cliamte change is going to be a problem].
14. We acknowledge that the UNFCCC is the appropriate forum for negotiating future action on climate change. Those of us who have ratified the Kyoto Protocol welcome its entry into force and will work to make it a success. [The Italians have been getting wobbly on Kyoto; if they've signed this, maybe they've unwobbled a bit]
Overall: very weak. Probably means that nothing significant will be done & no policy changes are in prospect.
2005-07-07
House of Lords subverted by skeptics...
The House of Lords Select Committee on Economic Affairs has produced a report on The Economics of Climate Change (pdf). Initial impressions of it are poor. It fails to understand the distinctions between the different IPCC working groups. Being economic folk, they keep saying things like We welcome this recognition of the central role of economics in big bold letters. And they say The Committee decided to restrict the scope of its investigation to certain aspects of the economics of climate change. But... they are lying. Because they decided to talk nonsense about the Great Hockey Stick debate. They manage to say: We sought evidence that refuted the claims of McIntyre and McKitrick, but have not come across any detailed rebuttal. But this is where they have degenerated into bald-faced lying. Because had they contacted Mann (clearly they didn't) he would have pointed them to such. For heavens sake, its on the web at RC: Dummies guide to the latest “Hockey Stick” controversy has some info and links. But they do seem to have noticed that One curious feature of the debate over Professor Mann’s time series is that the critics appear to ignore other studies which secure similar hockey stick pictures..
There is a weird bit (para 15), possibly somewhat garbled, that indicates that Lindzen is still pushing nonsense: In the view of Professor Richard Lindzen of MIT, current climate models would have predicted a substantially greater increase in the past temperature than has been observed in the past 150 years, perhaps +3oC compared to the +0.6oC we have witnessed.. Err... but (as the report then goes on to point out) GCMs actually replicate the T record since 1860 pretty well (SPM, fig 4). Presumably what Lindzen is trying to say is that if you omit important forcings, you get the wrong answer, but this is bleedin' obvious. And where he gets 3oC from is a mystery.
Later on they manage to say: apparent divergences between land-based temperature records and satellite-based measurements, the latter showing some cooling rather than warming in recent years...? Unless they want people to wipe their bottoms on their shiny new report, they're going to have to do better than this.
They are on firmer ground - or so one might have hoped - on emissions scenarios/SRES (para 52 and on). Unfortunately they strongly overweight the value of Castles and Henderson, and they manage to wurble stupidly about the probablility of the various scenarios. But really... if they're decent economists, why don't the stop p*ss*ng around and just generate their own more reasonable scenario? Why haven't C+H? And... after all their ranting about MER/PPP, it makes hardly any difference (table 3).
After this there is a long bit on impacts/economics, that I skipped.
Then they get onto the traditional bit about how the "Summary for Policymakers" sections are written. Personally, I think it would be excellent if the US and Saudi govt's weren't allow to b*gg*r about with those bits, but sadly its all written down in the IPCC constitution that the SPMs are agreed line by line by govts, and I rather doubt that it will change. All of that section looks to me like its slanted with anti-IPCC bias, BTW. Well, most of the report does. Not so much the facts, but the tone.
Despite my professed desire to learn more about impacts, I got bored at this point, because clearly this isn't the place to learn from. Hey ho.
There is a weird bit (para 15), possibly somewhat garbled, that indicates that Lindzen is still pushing nonsense: In the view of Professor Richard Lindzen of MIT, current climate models would have predicted a substantially greater increase in the past temperature than has been observed in the past 150 years, perhaps +3oC compared to the +0.6oC we have witnessed.. Err... but (as the report then goes on to point out) GCMs actually replicate the T record since 1860 pretty well (SPM, fig 4). Presumably what Lindzen is trying to say is that if you omit important forcings, you get the wrong answer, but this is bleedin' obvious. And where he gets 3oC from is a mystery.
Later on they manage to say: apparent divergences between land-based temperature records and satellite-based measurements, the latter showing some cooling rather than warming in recent years...? Unless they want people to wipe their bottoms on their shiny new report, they're going to have to do better than this.
They are on firmer ground - or so one might have hoped - on emissions scenarios/SRES (para 52 and on). Unfortunately they strongly overweight the value of Castles and Henderson, and they manage to wurble stupidly about the probablility of the various scenarios. But really... if they're decent economists, why don't the stop p*ss*ng around and just generate their own more reasonable scenario? Why haven't C+H? And... after all their ranting about MER/PPP, it makes hardly any difference (table 3).
After this there is a long bit on impacts/economics, that I skipped.
Then they get onto the traditional bit about how the "Summary for Policymakers" sections are written. Personally, I think it would be excellent if the US and Saudi govt's weren't allow to b*gg*r about with those bits, but sadly its all written down in the IPCC constitution that the SPMs are agreed line by line by govts, and I rather doubt that it will change. All of that section looks to me like its slanted with anti-IPCC bias, BTW. Well, most of the report does. Not so much the facts, but the tone.
Despite my professed desire to learn more about impacts, I got bored at this point, because clearly this isn't the place to learn from. Hey ho.
2005-07-06
Reading the Runes part II: Prometheus
Over at Promehteus, there is a forthright post on the latest Hockey Stick stuff. As usual, there is stuff in there whose tone I'd disagree with but there is some rather forthright language which I'd thoroughly agree with:
is blunt. Or:
And:
Quite right. And:
Tell me that I haven't been paying attention, but I haven't seen that unambiguously on Prometheus before. Lower down, I'd disagree with RP's tone, and he seems to have forgotten that Ammann and Wahl *have* replicated MBH. And It was clearly a mistake to use the MBH studies in the SPM is clearly wrong. Points 2 and 3 are badly wrong too, but hey you can't have everything.
From the perspective of climate science or policy Rep. Barton’s inquiry is simply inane
is blunt. Or:
Of course, it is doubtful that Rep. Barton’s Committee (on Energy and Commerce, I remind you) actually has any real interest in the science of climate change, except as a tool of tactical advantage in the continuing political battle over global warming. Rep. Barton and others opposed to action on climate change will continue to gnaw at the hockey stick like a dog on a bone so long as they perceive that it confers some political benefits.
And:
The debate also consumes a lot of scarce attention on the climate issue – attention that would be better devoted to debates about policy options.
Quite right. And:
Of course, most Prometheus readers will know that the case for a human influence on climate is well established through multiple independent lines of research.
Tell me that I haven't been paying attention, but I haven't seen that unambiguously on Prometheus before. Lower down, I'd disagree with RP's tone, and he seems to have forgotten that Ammann and Wahl *have* replicated MBH. And It was clearly a mistake to use the MBH studies in the SPM is clearly wrong. Points 2 and 3 are badly wrong too, but hey you can't have everything.
Reading the Runes
mt points out over in sci.env that the NYT says (registration required)
Now this is close to Kremlinology, but although this is weak stuff (no numbers) Bush appears to be saying that the earth getting warmer is a problem; and that people are contributing to it. Many skeptics have gone over, from denying any human influence, to saying "of course there is an influence but its small". Bush is obviously avoiding, so far, the std.consensus that "most of the warming observed over the last 50 years is attributable to human activities" (IPCC) but saying that our emissions are contrib uting to a problem is, although weaselly, a fair step in the right direction.
Meanwhile, some more entrails, this time of the public sort. "Overwhelming Majority of Americans Favors US Joining With G8 Members to Limit Greenhouse Gas Emissions" says PIPA (tip: Chris Mooney). Also "The percentage saying that 'there is a consensus among the great majority of scientists that global warming exists and could do significant damage' has risen from 43% in June 2004 to 52% today. The percentage saying that 'scientists are divided on the existence of global warming and its impact' has dropped from 50% to 39%". Unfortunately, this mixes existence with impacts; I'm not really sure how I would answer such a question. I really must read up on the impacts literature sometime.
Mr. Bush made a nod to the compromise effort at the news conference, saying, "I recognize that the surface of the earth is warmer and that an increase in greenhouse gases caused by humans is contributing to the problem."
Now this is close to Kremlinology, but although this is weak stuff (no numbers) Bush appears to be saying that the earth getting warmer is a problem; and that people are contributing to it. Many skeptics have gone over, from denying any human influence, to saying "of course there is an influence but its small". Bush is obviously avoiding, so far, the std.consensus that "most of the warming observed over the last 50 years is attributable to human activities" (IPCC) but saying that our emissions are contrib uting to a problem is, although weaselly, a fair step in the right direction.
Meanwhile, some more entrails, this time of the public sort. "Overwhelming Majority of Americans Favors US Joining With G8 Members to Limit Greenhouse Gas Emissions" says PIPA (tip: Chris Mooney). Also "The percentage saying that 'there is a consensus among the great majority of scientists that global warming exists and could do significant damage' has risen from 43% in June 2004 to 52% today. The percentage saying that 'scientists are divided on the existence of global warming and its impact' has dropped from 50% to 39%". Unfortunately, this mixes existence with impacts; I'm not really sure how I would answer such a question. I really must read up on the impacts literature sometime.
2005-07-04
Something happy for a change: Portland
From an article in the NYT:
Newly released data show that Portland, America's environmental laboratory, has achieved stunning reductions in carbon emissions. It has reduced emissions below the levels of 1990, the benchmark for the Kyoto accord, while booming economically.
What's more, officials in Portland insist that the campaign to cut carbon emissions has entailed no significant economic price, and on the contrary has brought the city huge benefits: less tax money spent on energy, more convenient transportation, a greener city, and expertise in energy efficiency that is helping local businesses win contracts worldwide...
2005-07-01
More Barton/Mann/Waxman
David Appell (here; and his prev) and Chris Mooney have more on the "Barton affair". Waxman says:
Indeed. So its good to see a heavyweight politician coming in on the side of science. Of course, this could just be a democrat-republican fight. The original Barton letters were politics/$ not science, so its probably right for this to turn, nakedly, into a political fight.
Interestingly, though, no-one seems to have anticipated this (even the normally politically astute Prometheus), even though it is (in retrospect) obvious.
BTW: JF: can you get CM back on PF please?
These letters do not appear to be a serious attempt to understand the science of global warming. Some might interpret them as a transparent effort to bully and harass climate change experts who have reached conclusions with which you disagree.
Indeed. So its good to see a heavyweight politician coming in on the side of science. Of course, this could just be a democrat-republican fight. The original Barton letters were politics/$ not science, so its probably right for this to turn, nakedly, into a political fight.
Interestingly, though, no-one seems to have anticipated this (even the normally politically astute Prometheus), even though it is (in retrospect) obvious.
BTW: JF: can you get CM back on PF please?
More satellite stuff, including explanations, a bit
When I wrote my prev post (BTW, the same caveats about data handling that I made there still apply), I was in a bit of a hurry and included little in the way of background. So... there is some good stuff at http://en.wikipedia.org/wiki/Satellite_temperature_measurements (well I wrote most of it). That page also includes links to various groups, but RSS is Remote Sensing Systems and S+C/UAH is here and other places; but their pages are in a bit of flux because they haven't caught up with their latest correction yet! The RSS pages have some nice descriptions of how the stuff all works.
Anyway, I've done a few more pics: here are maps of the trends (1979-2004, from annual mean data) from S+C vn5.2, 5.1, RSS and 5.2-5.1:
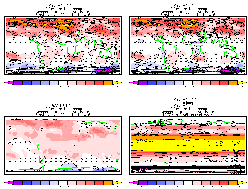
The last is quite startling, to me: it looks like an essentially zonally symmetric correction in the tropics. Odd.
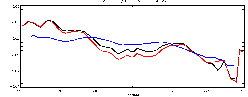
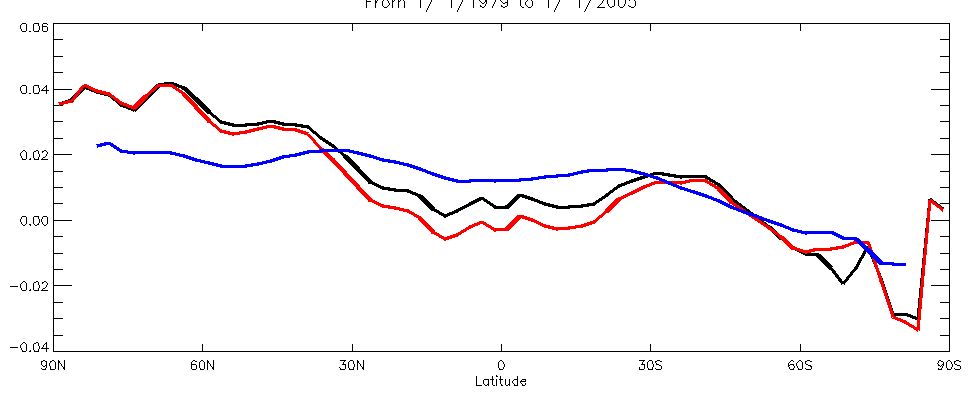
And then the zonal means of the trends:
Also interesting (perhaps) is the trends to-year for the two series:
These are the trends calc from the monthly data, from jan 1979 to dec of (year). They aren't quite the same as the ones on the wiki page (for 5.1) but thats probably down to minor processing (my area avg vs theirs, perhaps). So on my version of their v5.2, the negative trends stop in 1994, 3 years earlier than for 5.1.
Meanwhile... over at Deltoid, Scott Church commented: Note that these are TLT trends, so they won’t compare directly with current versions of RSS MSU trends which are for the middle troposphere (the corresponding UAH trends for an RSS or Prabhakara comparison will be TMT). I'm actually a teensy bit confused about the various products and levels. The S+C vn5.1/5.2's are definitely comparable. The RSS data may not quite be. The RSS stuff is their TMT product, which is a merge of MSU channel 2 and some AMSU data.
Anyway, I've done a few more pics: here are maps of the trends (1979-2004, from annual mean data) from S+C vn5.2, 5.1, RSS and 5.2-5.1:

The last is quite startling, to me: it looks like an essentially zonally symmetric correction in the tropics. Odd.
And then the zonal means of the trends:
Also interesting (perhaps) is the trends to-year for the two series:
year  5.2     5.1
1992  0.0009 -0.0005
1993 -0.0025 -0.0046
1994 -0.0017 -0.0045
1995  0.0015 -0.0014
1996  0.0021 -0.0008
1997  0.0028 -0.0001
1998  0.0099  0.0070
1999  0.0089  0.0058
2000  0.0080  0.0046
2001  0.0090  0.0054
2002  0.0108  0.0072
2003  0.0117  0.0080
These are the trends calc from the monthly data, from jan 1979 to dec of (year). They aren't quite the same as the ones on the wiki page (for 5.1) but thats probably down to minor processing (my area avg vs theirs, perhaps). So on my version of their v5.2, the negative trends stop in 1994, 3 years earlier than for 5.1.
Meanwhile... over at Deltoid, Scott Church commented: Note that these are TLT trends, so they won’t compare directly with current versions of RSS MSU trends which are for the middle troposphere (the corresponding UAH trends for an RSS or Prabhakara comparison will be TMT). I'm actually a teensy bit confused about the various products and levels. The S+C vn5.1/5.2's are definitely comparable. The RSS data may not quite be. The RSS stuff is their TMT product, which is a merge of MSU channel 2 and some AMSU data.
2005-06-30
First look at S+C's MSU vn5.2?
I don't think S+C have officially released their new "corrected" MSU LT data, but there are files on their ftp site called _5.2 with a date of 30th June. So I'm assuming thats it. I need to write this post in a hurry cos James A challenged me to a blogging race to be first to the data. I've had to read them in, calc the global means, and then the trends myself. So this is an ever-so-slightly dodgy process. But, I'm using the same code as I used for vn5.1, which appeared to work, so likely this does too. It gets about the right answer (trend 0.116 oC/decade over 1979/01 to 2004/12) so thats nice too.
Here are some pics:
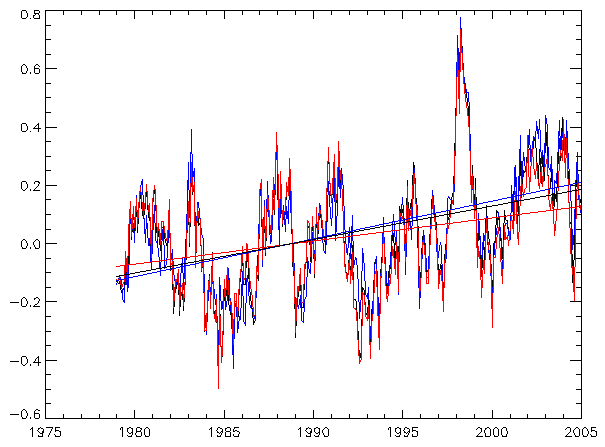
The black is the 5.2 series; the red is the 5.1; the blue is RSS. Trend lines are drawn on.
That pic is a bit hard to read: you might find:
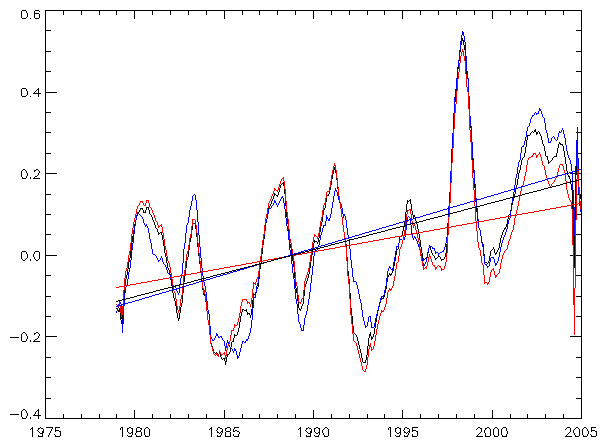
a bit easier. That is an 11-month running mean to remove some of the wiggles (except at the end points...). Some interesting features appear in that, which are clearer in a difference plot:
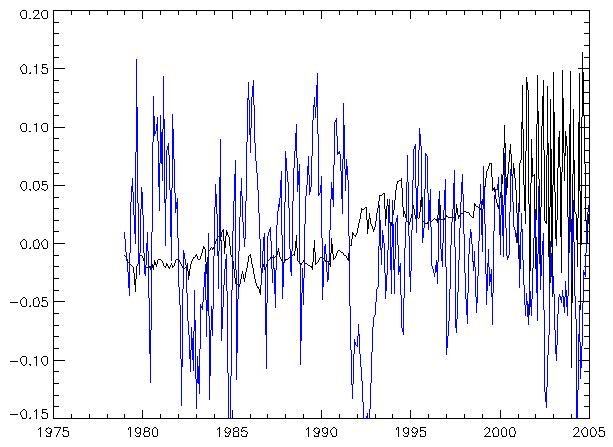
Black is now S+C 5.2-5.1; blue is 5.2-RSS (and the RSS is vn2.1, I think).
So... there is a jump between 5.2/5.1 around 1992/3 (who knows when the satellites changed?); and it goes all wiggly after 2001. Interesting.
Well, there you are. Don't get too excited because I by no means guarantee that this is (a) correct or (b) that the 5.2 files are indeed the correction that S+C promised. Time will tell.
Here are some pics:
The black is the 5.2 series; the red is the 5.1; the blue is RSS. Trend lines are drawn on.
That pic is a bit hard to read: you might find:
a bit easier. That is an 11-month running mean to remove some of the wiggles (except at the end points...). Some interesting features appear in that, which are clearer in a difference plot:
Black is now S+C 5.2-5.1; blue is 5.2-RSS (and the RSS is vn2.1, I think).
So... there is a jump between 5.2/5.1 around 1992/3 (who knows when the satellites changed?); and it goes all wiggly after 2001. Interesting.
Well, there you are. Don't get too excited because I by no means guarantee that this is (a) correct or (b) that the 5.2 files are indeed the correction that S+C promised. Time will tell.
Gobbledegook from Yury Izrael
Some while ago, Prometheus (always first with the news...) complained about IPCC authors misusing their titles. Yury Izrael (or, as he styles himself, "Yury Izrael, Director, Global Climate and Ecology Institute, Russian Academy of Sciences and IPCC Vice President") is now hard at it, at RIA Novosti ("Present-day global warming resembles the 1940s"... well, no it doesn't its warmer now; the garbled ice-age bit; etc).
In this case, its perfectly clear that the IPCC don't agree with him, and given the recent academies statement (signed by the RAS) its clear he's not speaking for the RAS either.
Its puzzling that he is an IPCC vice-chair, given his apparent lack of any scientific interest in the issue. He appears (page 2) to be one of 3 vice-chairs of the IPCC bureau (none of whom I've heard of... this may not be their fault, it may be our interests don't overlap; or it may well be because the vice-chairship is a political sop to be given to placate certain interests). But then again, I'm not clear what the IPCC Bureau actually does... it doesn't look like he is connected to the IPCC WG's.
OTOH, although he is doing his best to make skeptic-like statements, he's still with the IPCC consensus:
So for T change and SRL, he's straight down the IPCC line - no room for James's bets, sadly. This seems to becoming the way: skeptics are now accepting the IPCC views (YI isn't even trying to argue for the low end of the range) but embedding it in dodgy language. Progress, perhaps. Incidentally, whilst I wouldn't agree with "I do not think that this threatens mankind" (too definitively dismissive) I have some sympathy for that view, as I've written elsewhere. If skeptics like YI could just rephrase their language a bit, things could be so much better. All he is really saying is "We accept the WGI consensus but don't agree on the future damage". But perhaps thats too boring an opinion to print.
In this case, its perfectly clear that the IPCC don't agree with him, and given the recent academies statement (signed by the RAS) its clear he's not speaking for the RAS either.
Its puzzling that he is an IPCC vice-chair, given his apparent lack of any scientific interest in the issue. He appears (page 2) to be one of 3 vice-chairs of the IPCC bureau (none of whom I've heard of... this may not be their fault, it may be our interests don't overlap; or it may well be because the vice-chairship is a political sop to be given to placate certain interests). But then again, I'm not clear what the IPCC Bureau actually does... it doesn't look like he is connected to the IPCC WG's.
OTOH, although he is doing his best to make skeptic-like statements, he's still with the IPCC consensus:
Global temperatures will likely rise by 1.4-5.8 degrees during the next 100 years. The average increase will be three degrees. I do not think that this threatens mankind. Sea levels, due to rise by 47 cm in the 21st century, will not threaten port cities.
So for T change and SRL, he's straight down the IPCC line - no room for James's bets, sadly. This seems to becoming the way: skeptics are now accepting the IPCC views (YI isn't even trying to argue for the low end of the range) but embedding it in dodgy language. Progress, perhaps. Incidentally, whilst I wouldn't agree with "I do not think that this threatens mankind" (too definitively dismissive) I have some sympathy for that view, as I've written elsewhere. If skeptics like YI could just rephrase their language a bit, things could be so much better. All he is really saying is "We accept the WGI consensus but don't agree on the future damage". But perhaps thats too boring an opinion to print.
2005-06-28
Joe Barton (R-Exxon) vs hockey stick
I've stolen my headline from Tim Lambert, I'm sure he'll appreciate the imitiation. But Chris Mooney broke the story. So the naughty (and rather desperate) republicans are down to witchunting (cue Monty Python... except, one presumes, for the denouement). TL has a nice round-up of reaction from the blogosphere, all outraged by this attack (as am I). One notable exception to this sanity is Prometheus (but not RP), where KV manages to forget that the original MBH is 98, in order to push some cheap rhetorical tricks.
To inject a tiny bit of science into this... if you look at the nice piccy that Dragons flight created to display the variety of 1000 (and 2000) year temperature reconstructions, you discover that *all* of them fit the words of the IPCC TAR SPM:
This is all still true (the fact that 1998 is still warmest is just chance, of course) with any of the other records. Which shows you that the TAR was quite cautious in its use of the MBH record (which was entirely appropriate, it being fairly new then). So attacking Mann (or, being more charitable, attacking MBH98) is pointless, from a scientific standpoint. But then, this isn't about science, its about $.
Now that I have a chance to reflect, perhaps the Black Knight scene is more approriate...
To inject a tiny bit of science into this... if you look at the nice piccy that Dragons flight created to display the variety of 1000 (and 2000) year temperature reconstructions, you discover that *all* of them fit the words of the IPCC TAR SPM:

New analyses of proxy data for the Northern Hemisphere indicate that the increase in temperature in the 20th century is likely to have been the largest of any century during the past 1,000 years. It is also likely that, in the Northern Hemisphere, the 1990s was the warmest decade and 1998 the warmest year [1].
This is all still true (the fact that 1998 is still warmest is just chance, of course) with any of the other records. Which shows you that the TAR was quite cautious in its use of the MBH record (which was entirely appropriate, it being fairly new then). So attacking Mann (or, being more charitable, attacking MBH98) is pointless, from a scientific standpoint. But then, this isn't about science, its about $.
Now that I have a chance to reflect, perhaps the Black Knight scene is more approriate...
S+C/UAH MSU temperature trend now 0.12 oC/decade
If you look at http://climate.uah.edu/may2005.htm you'll find that the S+C MSU temperature trend for the troposphere is now 0.12 oC/decade. Last month it was only about 0.08 oC. Presumably, some recalculation has gone on, but I don't know what. I couldn't see anything obvious on their site.
For those asleep, the S+C record has for some time been notably lower than the others (see http://en.wikipedia.org/wiki/Satellite_temperature_measurements) but now is quite similar to the Mears et al value. See-also my last post, which was just a coincidence...
Isn't this interesting?
For those asleep, the S+C record has for some time been notably lower than the others (see http://en.wikipedia.org/wiki/Satellite_temperature_measurements) but now is quite similar to the Mears et al value. See-also my last post, which was just a coincidence...
Isn't this interesting?
2005-06-27
I'm number 4!
At the start of this month, I was able to proudly announce that I was the #7 google hit (or #6, for google.co.uk) for the word "stoat". Now I've shot up the rankings to #4 (or #3)!
For reference, my so-called competitors are:
http://www.stoatmusic.com/ - Indie pop/rock band based in Dublin
http://www.yptenc.org.uk/docs/factsheets/animal_facts/stoat.html - facts about real stoats
http://www.bbc.co.uk/nature/wildfacts/factfiles/201.shtml - ditto, from the BBC
Now I've linked to them and helped perpetuate their dominance :-(
Amusingly, when I do the google search the side-bar ads come up with:
Are people really looking for great deals on stoat? There turn out to be quite a few stoat-related items on sale. Perhaps you're interested in TAXIDERMY..STOAT IN GLASS CASE..LOVELY ITEM. Or perhaps not.
Ahem. Thats enough stoat-related nonsense for today. Later... the return of the science. I promisxe.
For reference, my so-called competitors are:
Now I've linked to them and helped perpetuate their dominance :-(
Amusingly, when I do the google search the side-bar ads come up with:
Stoat
Great deals on Stoat
Browse a huge selection now!
www.eBay.com
Are people really looking for great deals on stoat? There turn out to be quite a few stoat-related items on sale. Perhaps you're interested in TAXIDERMY..STOAT IN GLASS CASE..LOVELY ITEM. Or perhaps not.
Ahem. Thats enough stoat-related nonsense for today. Later... the return of the science. I promisxe.
Subscribe to:
Posts (Atom)