2005-11-14

Your comment was denied for questionable content.

Over at Jennifer Marohasy on politics and the environment there was some kind of debate over the stupid HoL economics-of-IPCC report. Belatedly, I thought I'd join in. So I posted the comment below, but got back Your comment was denied for questionable content... shades of an earlier post!

So I shall post it here, and you can judge. This version has a few words like "tedious" and "nitpicking" removed, but still it fails. Can anyone guess what the problem is?


Am I too late to join this exciting debate?

Early on, someone said: The hockeystick, and the hockeystick alone, was the reason for the claims that this was the warmest century in the last long time.

But if you actually read the IPCC TAR (does anyone?) it says "Globally, it is very likely7 that the 1990s was the warmest decade and 1998 the warmest year in the instrumental record, since 1861" and "the increase in temperature in the 20th century is likely7 to have been the largest of any century during the past 1,000 years. It is also likely7 that, in the Northern Hemisphere, the 1990s was the warmest decade and 1998 the warmest year". What is *doesn't* say is that the 20C was the warmest.

The amusing thing, of course, is that everything the TAR said about the hockey stick remains valid for all the reconstructions subsequently published (see http://mustelid.blogspot.com/2005/10/increase-in-temperature-in-20th.html).

Continuing, someone challenged Mann to say why this hockey stick debate really really matters. Well the answer is: it doesn't really. See http://mustelid.blogspot.com/2005/11/big-picture.html

Oh, and as for all the SRES stuff... its tedious. If these poor dear marginalised economists want to produce their own CO2 projections... why don't they just do so?

2005-11-13

Arctic temperature trends and data sparsity

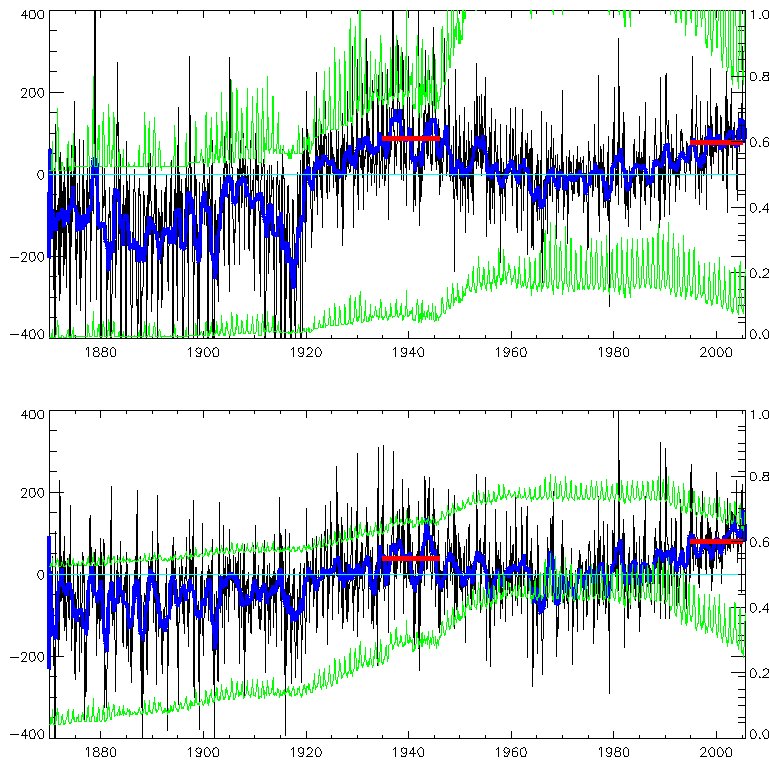
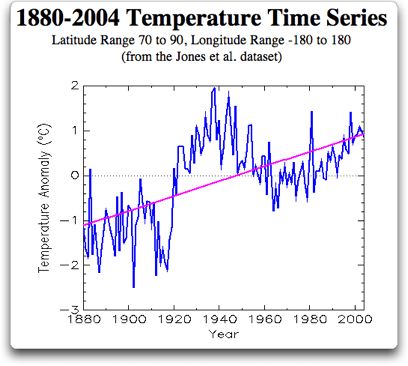
Whilst browsing the wilder shores of skepticism (well, I'd just been to Ikea and needed some light relief...) I came across the inaccurately titled "Reality in Arctic temperature trends. Scroll down about 1/4 of the way to the 1880-2004 temperature plot. So... temperatures higher in 1935-1945 than now? Interesting! And using CRU data too. How come... Well, one funny thing is that he calls this "A sobering dose of reality" - presumably forgetting that elsewhere he has attacked the Jones data as the spawn of the Devil. A second funny thing is that he is using [70,90]... [60,90] is more usual. Would you get the same results for [60,90]? And are there really many stations between [70,90] in the early period?

I'm sure you can guess the answers, and its "no" to both. Have a look at my pic (but be careful, there are lots of lines...). The top graph is [70,90]. The bottom graph is [60,90]. Both show the area-averaged temperature anomaly (in black; the 13-month running mean is in blue) from the HadCRUT2v dataset, in 100's of oC, which is why the left hand scale is 100 times bigger than you think it ought to be. Both plots have the same general shape, but for the wider area the current (last 10 years, mean given by red bar) temps are higher than for the 1935-1945 average. But even for [70,90] the temps in 1935-45 are only marginally higher than now - about 0.1 oC - hardly "much higher than today" as our septic claims.

But... look at the green lines. The lower green line on each plot is the fraction of the area covered by obs, on the right-hand scale. So for [60,90] about 40% of the area is observed, since 1960. In the 1940's, about 30%. For [70,90] about 20% is observed, recently (though with a huge annual cycle: far more people about in summer!) and less than 10% in the 1940's. Our septic complains that the "Arctic Climate Impact Assessment (ACIA) start their temperature records in 1960". Errm yes, well that might well be a good idea. Perhaps the ACIA people actually bothered to look at the data rather than just area-averaging it.

In fact, to my not-great-surprise, the ACIA people do indeed look at temperatures before 1960 (hint: if a septic sez something is true, its probably false...) and even draw nice maps of the trends at various time intervals: see the ACIA sci report, p36 and after. But they note the data sparsity problems early on.

The total *number* of filled 5x5 degree gridboxes is the upper green line on each plot, and the scale is (conveniently) the [0,400] of the upper half of the temperature scale (has your mind exploded yet?) *except* that for [70,90] that would be too small to see so I've multiplied it by 10 (boom!). So at the time of that huge (and rather suspicious...) jump in the upper plot at 1919, there were only 5 (=50/10) stations. For [60,90] there are nearly 200 filled boxes, recently.

Just looking at fraction-of-obs can be a bit dry, so here are maps of gridboxes filled (with their anomaly values, no in sensible units) for July 1919, 1940 and 2000. Note that using July maximises the filled boxes for the year. Its pretty obvious that 1919 is *very* sparse; 1940 is sparse; but even 2000 isn't exactly packed, north of 70; though its pretty good from 70 to 60 (oh, the black circles are 60 and 70 N, of course).

So... what do we learn from all this (apart from never trust the septics, but we knew that already)? We learn that plucking a dataset off the shelf and playing with it and only showing the end result may well mislead... we learn that you should be cautious with sparse data.

Weaselly behaviour

Via Wolfgang via CIP, I learn of Scott Adams Weasel Poll - weaseliest individual is Bush and weaseliest org is the Whitehouse. Reporting it as "finding supplies" when white people loot does creditably in the weaselly behaviour category. Though if you ask me SA can't draw weasels for toffee (his look like rats); and his weasel day mustelid is actually a ferret.

Also, this is a good recent one...

2005-11-11

Scary scaling

A while ago - back in 2002 I suppose - I heard vague refs to a paper about "scaling" which somehow demonstrated global climate models fail to reproduce real climate when they are tested against observed conditions. Since this was being posted to sci.env by the usual nutters I didn't pay too much attention, and as far as I can see neither did anyone else; though it occaisionally recurs. For one thing, the original article was published in Phys Rev Lett which I (and I think most climate folk) don't read; and pdfs weren't scattered across the web quite as freely in those days. And for another, whatever they were saying was so abstruse as to appear meaningless (even the nutters didn't push it much, because they had no idea what it was about either).

However, someone who isn't a nutter (thanks Nick! But I was right: its the Israelis) has re-drawn it to my attention, and even provided me with it on paper, so I've read it. You can too: its Global Climate Models Violate Scaling of the Observed Atmospheric Variability by R. B. Govindan Dmitry Vyushin Armin Bunde, Stephen Brenner, Shlomo Havlin and Hans-Joachim Schellnhuber. And it did get some attention: e.g. from Nature (subs req) (reputable of course, but sometimes over-excitable). But... is it any good?

Weeeeeelllll... probably not. This is yet more of the fitting power laws to things stuff. They use "detrended fluctuation analysis" (DFA) which I don't understand, but that doesn't matter, we'll just read the results. So... Govindan et al. do their DFA on observations from 6 (rather oddly chosen) stations; and 6 GCMs. The first oddness is their chosing Prague, Kasan, Seoul, Luling (Texas), Vancouver and Melbourne as represenatative of the world. Never mind. They get A ~ 0.65 for these stations. Don't worry too much about what A is; its related to the memory of the system: A ~ 0.5 is no memory (white noise); A ~ 1 is long memory (red noise). They assert boldly that this 0.65 is therefore an Universal Value. They discover that the GCMs, forced by GHGs only, by contrast get A ~ 0.5. Which, says Govindan et al., means that the GCMs overestimate the trends. Just to make sure that you won't miss this, they repeat the same at the end. But... this is not news. The fact that GCMs forced only by GHG's overestimate the trends is in the TAR (like just about everything else you need to know about climate change, its in the SPM, as fig 4). When you add in sulphates, the A from the models increases somewhat (to 0.56-0.62 ish); but thats arguably still too low. So whats up?

Which is where we turn to... Fraedrich and Blender, Scaling of Atmosphere and Ocean Temperature Correlations in Observations and Climate Models. Also in PRL. Who argue that G et al. are wrong: their Universal Value of A ~ 0.65 is not universal at all. They do a much wider analysis: instead of just a few stations, they use a gridded dataset across as much of the globe as they can. And they find (surprise!) exactly what you would expect: over the oceans, high A (~ 0.9) and over the continental interiors, low A (~ 0.5) and in between, mixed A (~ 0.65). Why is this exactly what you expect? Because the ocean has a long memory but the land doesn't. And... if you draw the same plot in a GCM (ECHAM4/HOPE) you get a remarkably similar pattern. So they come to a quite opposite conclusion: the DFA analysis actually shows the GCM performing rather well. And they conclude: The main results of this Letter follow in brief: (i) The exponent A ~ 0.65 is predominantly confined to coasts and land regions under maritime influence. (ii) Coupled atmosphere-ocean models are able to reproduce the observed behavior up to decades. (iii) Long time memory on centennial time scales is found only with a comprehensive ocean model. That last point arises because they tried the same analysis with a slab ocean and with fixed ocean; unsurprisingly, the scaling doesn't work in those cases.

F+B also picked their own seemingly odd station, Krasnojarsk, as a continental interior station, and showed (their fig 1) a scaling of A ~ 0.5 between 1y-decadal scales. At this point Govindan drops out, but some of the original authors reply, saying that (i) the scaling isn't 0.5 at K; and (ii) it isn't 0.5 at other interior points too (they pick yet another scatter of random stations). F+B reply, that (i) Oh yes it is (ii) maybe its the fitting interval: they use 1-15 years; the others are using 150-2500 days. On (i), looking at the pics, I'm with F+B and I can't see what the others are up to.

F+B, incidentally, argue that a control-run GCM (ie no external forcing) is quite good enough to get the long-timescale correlations, and that other forcing doesn't much help (for these purposes at least; you might perhaps have argued that adding in solar forcing and volcanic and stuff might help further). In Blender, R. and K. Fraedrich, 2004: Comment on "Volcanic forcing improves atmosphere-ocean coupled general circulation model scaling performance" by D. Vyushin, I. Zhidkov, S. Havlin, A. Bunde, and S. Brenner, Geophys. Res. Letters, 31 (22), L22502. DOI: 10.1029/2004GL021317 they criticise Vyushin (one of the et al. with G) for suggesting that volcanic helps, on the grounds that it simply isn't needed to get these A values right.

So after all that, what do we end up with, and what have we learnt? Assuming F+B are more right (and I think they probably are, based on what I've read so far) we've learnt very little. The fact that T increases are bigger sans aerosols is bleedin' obvious; as is the longer memoery of the oceans. We have a validation of the GCMs by another measure, but a rather abstruse measure and not an obviously useful one.

I'm an "Adorable Little Rodent"!

I've finally succumbed and got a blog counter (from blogpatrol). Its off down the side underneath the ads... I started it at 40k, which is where google adsense says I am (approximately); but now everyone can see not just me. Out of compliment to CIP (where I got the idea) I chose the same style as him. CIP also has a rather more gracious way with words than me, so I'll use his:

I would just like to thank all of you for stopping by. I'm especially grateful to those who leave a comment, even if it is just to tell me I'm wrong, crazy and or stupid! Especially if you explain your reasoning


I do indeed thank you for stopping by... but just to prove that I am less gracious than CIP I'll add comments are only welcome providing you are polite.

However the title of this post refers to my place in the TTLB ecosystem (see the sidelink somewhere) where I have moved up from "Slithering Reptile" (back in September; then, CIP was only a Flippery Fish, now he's been promoted to Crawly Amphibian!). I wonder if there is a mustelid category, though Adorable Rodent is close-ish.

2005-11-10

Timing of Dansgaard-Oeschger cycles

A tentative post this, unlike my usual strident opinions :-)

The starting point is Timing of abrupt climate change: A precise clock by Stefan Rahmstorf (GRL, 2003), and also recent RC: chaos and climate (check the comments). When I first read the GRL paper I somewhat distrusted it. I'm not sure why. The basic idea of that paper is that the [[Dansgaard-Oeschger events]], which occur with approximately 1,500 year spacings in the last glacial, really are regularly spaced, albeit with occaisional "misses". This somewhat overturns what I thought was the conventional wisdom, which is that the D-O events are responses to the Laurentide ice sheet internal instabilities, or somesuch, and if so would only be quasi-periodic.

One problem with that view is that if they *are* truly on a clock, then that probably requires an astronomical clock, nothing on earth being regular enough. In todays Nature Braun et al (inc Rahmstorf) propose a Possible solar origin of the 1,470-year glacial climate cycle demonstrated in a coupled model which they get from combinations of the De Vries (210) and Gleissberg (86.5) cycles. I only mention that to draw it to your attention; I have no opinion as yet.

You only get the nice 1,470 spacing if you use the GISP core, and only for the first 50 kyr of it. Which is maybe why I was suspicious... it smacked of choosing your data carefully. But now, having overplotted this stuff a few times, I've come to appreciate that the GISP and GRIP timescales aren't the same. And (so it is claimed) the layer counting for the first 50 kyr of GISP makes it most accurate. Quite likely.

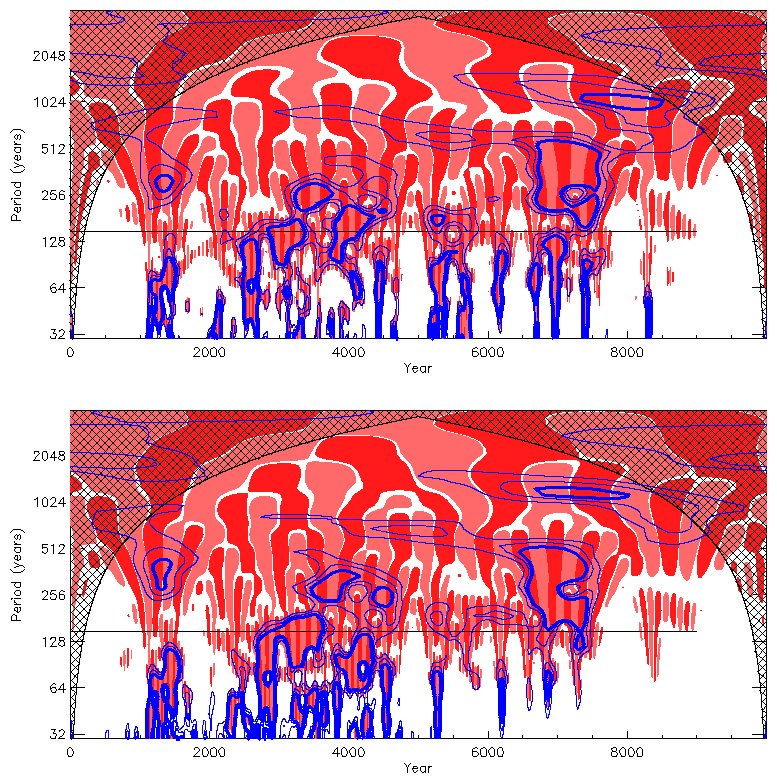
My own little contribution is the plot here. Sorry about the garish colours. Its a [[wavelet]] decomposition of the same delta-O-18 data. To do that I had to regrid the data onto a regular 10 year time grid, which is why that plot is lying about the timescale: for "year" read "decade". One plot is GISP. The other is GRIP. I forget which: if you really know your data you can discover which is which. Your clue, if you need one, is to look near the 40 kyr date. However, on this plot at least, GRIP and GISP look fairly similar. My own view is that on this view, the data looks quite noisy.

Errm, and thats it for now. Sorry there's no conclusion!

Rabett vs Pielke

Not everyone reads comments, so I point you to some interesting stuff in the latest RC post, in particular this by Eli Rabett criticising RP Jr's position: What you are doing here, and in your publications, and on Prometheus is to assert ownership of a series of issues, the latest of which is hurricane damage due to climate change. Your incessant self citation is a clear indication.... Strong stuff, and there is more. I look forward to the extended exchange.

2005-11-09

Politics: good news at last: Blur illiberalism routed briefly

"The prime minister has suffered a humiliating defeat" says R4 news at 6. Ho ho, schadenfreude, etc etc.

At last a bit of good news over the terrorist panic. MPs have finally stood up and told Blair to f*ck off over the proposal to hold people for 90 days without trial. So R4 5 o'clock news tells me, and this seems to confirm.

The margin is larger than expected: 31 votes. So the farce of recalling Brown from Israel to pack the lobby was a waste of time and money too.

In one aspect, though, the illiberals are already winning: the debate (insofar as anyone is seriously debating this rather than pontificating) is over how far the period should be extended from the current 14 days (more quietly, the news tells us that the HoC has just voted in favour of 28 days. Sigh. Celebrating too early... I would have suspected that 90 was all a cunning plot to get 28 days through quietly, except Blair nailed himself to the mast a bit too thoroughly for that). It should be about cutting it back down from 14.

But really, all this vast panic over terrorism is stupid. Car drivers kill far more people than terrorists do, but kill someone with a car and you probably won't get a 90 day sentence even if found guilty.

I'm curious: how long could you be held in the US (outside Guantanamo, of course) without being charged?

Vote for us!

Go on... click on the image... it will take you to the vote site, then you can vote for RealClimate, hurrah. Or click here for the current results... quick, click now...

2005-11-08

The Abdication of Oversight?

RP (Jr) has an interesting post The Abdication of Oversight. He begins by noting that Barton got his fingers burnt for his nonsense of last year (I paraphrase...) and this was one reason why Barton has wimped out of a follow up.

But he continues:

Providing ample evidence that the politicization of science by politicians is a bipartisan pastime, Congressman Dennis Kucinich (D-OH) and 150 fellow Democrats have introduced a rarely used "resolution of inquiry" to explore whether the Bush Administration has been hiding evidence that the current hurricane season has been caused by global warming. Kucinich said in press release last week:

"The American public deserve to know what the President knew about the effects climate change would have, and will continue to have, on our coasts. This Administration, and Congress, can no longer afford to overlook the overwhelming evidence of the devastating effect of global climate change. It is essential for our preparedness that we understand global climate change and take serious and immediate actions to slow its effects."


And challenges us all to condemn this as nonsense.

So... while I disagree with RP over some of the nuances of the hurricane issue (see Hurricanes and Global Warming - Is There a Connection? for my/RC's views) I would be happy to say that looking for a global warming signal in hurricanes is definitely the wrong place to start. Hurricanes are a noisy signal, hurricane damage is even worse: the least noisy signal is the temperature signal, and that the obvious place to look. Because of the particular track that Katrina took (and probably because levee money had been siphoned off to pay for a stupid war, but thats another matter...) it did an inordinate amount of damage. With a slightly different track (and there is no way to predict the exact track from GW) we would have a somewhat over-active season but no particularly exciting events.

The motion (as described above) is on completely the wrong track (ho ho) and looks like band-waggon jumping after an "exciting" event: from a climate science point of view what their motion should be about is something different. The real Bush failure is to acknowledge the considerable degree of certainty of the attribution of recent, well observed, climate change to anthropogenic factors. Bush/Republicans/Skeptics/Whoever need to start by acknowledging the existing warming as real (Bush has done this, but quietly and weakly) and stop quibbling about it; admit that the current best science attributes most of the warming to us and stop overplaying the uncertainty; and then have a proper policy-relevant type debate about what to do; in the meantime the scientist types can go back to quietly refining estimates of attribution an future warming.

Oh, and on a completely different topic: I liked this from CIP and point you to JA's latest failure to get the skeptics (Bill Gray) to ante up.

2005-11-07

Sh*t* frm Lindzen

Lindzen is a bit of a contrarian, but I had thought he mainly kept his skepticism within the bounds of reason and deserved his "k". I now find I'm wrong: I recently found Lindzens testimony for the House of Lords. Its so bad its funny. Consider:

Lord Kingsdown: Can I just go on to ask you how far your view of the role of water vapour is shared by other scientists?

Professor Lindzen: That is shared universally.


What utter bilge! Lindzen is out on a limb on his Iris Hypothesis, which has by now been discarded by just about everyone. He's welcome to like his own research himself, of course, but pretending that anyone else does is dishonest. The rest of it is cr*p too.

2005-11-03

How (coupled AO) GCMs work

Having done extensive research (a quick google search that threw up this excellent and well-referenced post but nothing much else; and reading comments at RC and elsewhere) its pretty clear to me that (a) almost no-one outside the immeadiate community knows how coupled ocean-atmosphere GCMs work and are used in climate modelling and prediction (or "projection" as the IPCC calls it); and (b) this may be because there are no webpages on it. If you fancy reading some GCM source code, then this will get you GISS ModelE; or this for HadCM3. But you're unlikely to learn much from it unless you're *very* determined.

So I'm going to write up a post on it. What I hope to do is produce a first draft here, publish it, get feedback from you lot on bits that are unclear (or mistaken? no...; still the ocean bit is thin) or missing, and update it until adequate. Or until I get bored. Also please comment if you can find a better description elsewhere. This from the Met Office is an example of something thats not much use...

For definiteness, I'm going to talk about coupled-atmos-ocean GCMs (AOGCMs, though I'll probably just say GCMs) which are the heavyweight tool for climate prediction. You can't do that with an atmos-only model. And the only ones I'm at all familiar with are HadCM3/HadGEM.

Components


AOGCMs have two main components (atmosphere and ocean of course) and two more minor components (sea ice and land surface). I suppose sea ice modellers (me!) or land surface folk might complain about me calling them minor. Delete the word if it offends you. Traditionally the land surface scheme sits inside the atmos model, and might well be considered part of it. The sea ice scheme might well sit inside the ocean model. Mostly.

Those are (I think) the essential bits. You can also have various optional bits (for example carbon cycle or atmospheric chemistry) but those are not needed. One very common mistake is to think that GCMs predict CO2 levels. Most don't. Most are run with observed CO2 (if post-dicting the past) or prescribed CO2 (either from an economic model or an idealised 1% increase, say) is predicting the future. Even a carbon cycle model would be run with prescribed anthro CO2 inputs. Most GCMs don't contain a glacier or icesheet model either, because the scales are incompatible: glaciers are too small, and ice sheets have millenial scales (HadCM3 has been run with a Greenland ice sheet, but only once, it took ages, and I think it was specially speeded up).

I'll add a forcings section at the bottom.

Discretisation and resolution


I'll only say a bit about this. This seems quite helpful.

For the atmosphere and the ocean the basic fluid dynamics equations need to be converted from their continuous (partial differential equation) form and discretised so that they can be handled by numerical approximation. For the atmosphere, this can take the form of a spectral or finite difference decomposition. I'm not going to talk about the spectral stuff, cos it will only confuse, and the end results are not much different. For the oceans you can't use spectral stuff anyway. What happens then is that instead of a continuous equation d(f)/dt=g(x,t) you end up with something like f_{x,t+dt}=f_{x,t}+G({x,t},{x-dx,t},{x+dx,t})... I'm handwaving for effect here (apart from anything else in a GCM the x's are 3D (lat, long and height)). The point is to end up with an expression for the values at time t+dt, in terms of things at time t (or use an implicit solution...). But anyway, this gives you two important parameters to choose: the timestep, dt; and the spatial discretisation dx.

Typical values for the atmosphere are 1/2 hour (or less) for the timestep; and 300 km for the horizontal; and about 20-40 levels in the vertical (not evenly spaced). At least for HadCM3 the ocean timestep is longer (1h) and the spatial less (1.25 degrees, about 100 km).

Space and time steps are related by the CFL criterion: as the space steps get smaller so must the time, to avoid instability. Note that there is resource/accuracy trade of in the timestepping: longer timesteps allow the model to run faster; shorter timesteps allow more accurate integration. In practice, I think, people take the largest timestep compatible with stability, since errors elsewhere mean the loss of accuracy from as large as possible timestep doesn't matter.

This pic gives you some idea of the grid cell size; this has refs and stuff.

Atmosphere


The atmosphere sort-of divides into two components: a dynamical core to handle the discretisation of the fluid dynamics; and a pile of physical parametrisations to handle things (clouds, for example) that don't get a fluid-dyn representation. Also radiation.

So the dynamical core handles the integration (i.e., getting from one time step to the next) of [u,v] (horizontal velocity and the various vertical levels) and p* (surface pressure) and omega (vertical velocity). Once the winds are known, other variables (q, moisture) can be advected around. It is generally reckoned that the GCM type scale (200-300 km gridpoints) is enough to resolve most of the energetic scales in the atmosphere.

At some point the bottom layer of the atmosphere needs to exchange fluxes (momentum and heat and moisture) with the surface, which is where the surface exchange scheme comes in, which counts as part of the atmosphere. Models typically have their lowest level at a few 10's of meters, which requires a parametrisation of the boundary layer exchange, point by point.

The radiation code handles the short wave (visible; solar) fluxes and the long-wave (infra-red) fluxes separately (since there is little overlap). The vertical column above each grid point is treated separately from the ones next door (since the cells are 100's of km wide but only 10's of km high, edge effects get neglected). SW comes in at the top, gets reflected, diffused, absorbed and generally bounced around of the atmos, the clouds and the sfc. Similarly the LW bounces around but also has sources. The radiation code, effectively, is the bit where enhanced CO2 (or other GHG forcing) gets inserted, by affecting the transmissivity of the atmosphere. In the real world radiation has a continuous spectrum (with lines in it...); in line-by-line codes thousands of lines and continua are specified; in GCM type codes each of the SW and LW radiation codes will deal with a small (~10) number of bands which amalgamate important lines and continua. Radiation codes are expensive: HadAM3 only calls the SW radiation 8 times a day.

There are separate schemes for the convective clouds and "large scale" clouds. LS clouds are those that are effectively resolved: if a grid box cools enough to get the cloud scheme invoked, then clouds form (once upon a time, this happened if the RH got above 100% (or perhaps 95%, with some ramping); nowadays I think its more complex). Convective clouds require a parametrisation: again this has evolved: once if a part of the column was convectively unstable it got overturned; now much more complex schemes exist. There is a lot of scope for different schemes I think. Ppn gets to fall as rain or snow according to temperature; it may re-evaporate on the way down if it falls through a dry layer. Once you have the clouds they need to feed into the radiation scheme. Clouds may be true model prognostics or get diagnosed at each timestep.


Ocean


I know less about the ocean code. The ocean is different in that it has boundaries. It also has (in the real world) more energy at smaller spatial scales and so is rather harder to get down to a resolution which properly resolves it. But still there is a dynamical core which solves for the transport.

Radiation pretty well gets absorbed in the upper layers so is less interesting than in the atmos case. Convection is rather less common, and mostly associated with brine rejection from sea ice (?), which needs parametrisation just like cumulus convection in the atmosphere.

Unlike the atmosphere, which exchanges interesting fluxes with the land surface, the bottom of the ocean isn't very interesting.


Sea ice


Sea ice is effectively an interface between atmos and ocean and insulates one from the other. It gets pushed by wind stress from the atmosphere, ocean-ice drag underneath, coriolis force and internal stresses (its is usually modelled as an (elastic) viscous plastic substance; the details of this are really quite interesting but complex).

In the Hadley models, it exists on the same grid as the ocean model. By affecting the albedo it also affects the ice-ocean interaction. If it has a different roughness length to the ocean, it will affect the momentum fluxes too.

Sea ice effectively splits into "dynamics" (moving it around) and "thermodynamics" (heat transfer through it, melting/freezing, albedo, etc).


Land surface


The land surface scheme needs to allow us to calculate the fluxes of heat, moisture and momentum with the atmosphere; and the radiative fluxes. Fortunately it doesn't move so doesn't need any dynamics so is often not a separate model.

Fluxes of heat are done by calculating the temperature at various depths in the soil which gets you a surface temperature, together with a surface roughness length (which depends on...). Fluxes of moisture are done by knowing the "soil" moisture based on some more or less sophisticated scheme (see PILPS) which will also affect the way falling precipitation is handled. This includes representations of evapotranspiration etc etc. Momentum just needs a roughness length, the stability or otherwise of the atmos BL, and possibly some representation of the unresolved orography.

Most such schemes have prescribed vegetation; but more exciting ones can have interactive vegetation schemes (the UKMO is called TRIFFID).

Any of this gets affected by an overlying snow cover; which obviously affects the albedo, but also insulates.

Forcing


This will be short, since I suspect you can find it better elsewhere.

A fully coupled model needs an initialisation state (usually 1860 or thereabouts if its to be used from simulating 20C and the future, to avoid cold start and stuff), prescribed CO2 (and other minor GHG) concentrations which vary through time; solar forcing (variable or not); volcanic and other aerosols. It may also get a varying land use. And thats about it (did I forget anything?). The point being to let it get on with it.

People occaisionally suggest that it would be a good idea to run them in semi-NWP mode and assimilate weather obs along the way, so that they track 20C temps as accurately as possible and predict the future as well as poss. This is plausible (in some ways) but not done.

Output


At the end of all this, you end up with values of temperature, velocity, humidity, cloud at 2*105 atmospheric gridpoints (or thereabouts) together with more in the ocean and many another variable besides, every half hour, for 200 years (or however long). Assuming you bothered to save them.

Oddly enough that level of detail is often not what you want. So the first thing to look at tends to be an area-average (often global) and time average (monthly; yearly) values of one variable of particular interest.

2005-11-02

Blur on climate change

Our glorious leader has been saying things about the politics of climate change again, which have been generally interpreted as weakening of Kyoto-type stuff. See the Grauniad. In fact he has been talking mostly about post-Kyoto (ie post 2012) so in some ways the question must be: why should he bother? He will be well out of it by then. BTW, I've ventured to spice this post up with a nice picture of a cloud from the Pictures blog by way of advertising.

Lets quote the Grauniad:

He said when the Kyoto protocol expires in 2012, the world would need a more sensitive framework for tackling global warming. "People fear some external force is going to impose some internal target on you ... to restrict your economic growth," he said. "I think in the world after 2012 we need to find a better, more sensitive set of mechanisms to deal with this problem." His words come in the build-up to UN talks in Montreal this month on how to combat global warming after Kyoto. "The blunt truth about the politics of climate change is that no country will want to sacrifice its economy in order to meet this challenge," he said.


Well, so far so politics so who cares? FOE do (different article):

Tony Juniper, director of Friends of the Earth, said: "We need to understand immediately what he means by that. His role at the moment is pivotal. He's the only world leader who's pushing climate change as an issue that has to be dealt with. So what he says is going to carry particular weight and he's basically just rewritten the history of climate change politics."


First of all, the request for clarification is unlikely to be met: ambiguity is what is being aimed for. Second, if TB really is "the only world leader who's pushing climate change" then nothing will be done: one against so many obviously won't work. Third I don't understand the re-writing bit: this is future not past.

The article continues...

Mr Blair has been seen as a strong supporter of the Kyoto protocol and was thought to be keen on working towards finding a successor to the treaty... As part of his support, the prime minister made tackling climate change his priority for the presidency of G8 and the EU this year, describing it as a greater threat to the world than terrorism.


Terrorism: did he? I thought that was Bob May. Although since terrorism kills so few people ranking X above terrorism as a threat hardly says much about the importance of X. Anyway, this now lines up a possible explanation, that Blair is angling to lead the post-Kyoto organisation in retirement from being PM. Farfeteched perhaps. Anyway, although Blur has been seen as a Kyoto supporter, thats mostly rhetoric and practical action is thin (Stoat passim). Nothing came out of G8 (Stoat passim). We (the UK) have Kyoto targets that look unattainable and voluntary additional targets (reaffirmed in the last election) that look even less attainable.

Second minister resigns for second time

David Blunkett has resigned again. So thats him *and* Mandleson who have resigned twice. Not bad for a goverment that promised to be whiter than white. The grauniad quotes Blur as saying: Mr Blunkett left office "with no stain of impropriety against him whatsoever" which is... err... why he resigned, of course (just like Mandleson). And in a stunning piece of irrelevance Blunkett apparently said having investments and holding shares in modern Britain is not a crime. Stuff likes that makes it hard to be sympathetic.

But... little sympathy as I have, the "crimes" here seem to be far less than those of people in Bush's administration. And the witch hunting (was it?) bears a certain resemblance to the M&M stuff.

Meanwhile (and probably more importantly) the terrible terrorism bill goes through by one vote (actually its not through yet: the even more controversial detention without trial for 3 months is yet to come and may well go down, hurrah).

Coming soon: Blair on climate change.

2005-11-01

The Big Picture

Its become pretty clear that many people are losing sight of the wood for the trees, or even the twigs, in the latest rounds of the Hockey Stick Wars. Fortunately some of the more intelligent watchers of the debates have realised they need help. So here it is.

What it the Big Picture? From the point of view of climate change, the top level is

The world is getting warmer, we're causing it, and it will continue to get warmer in the future. This is pretty well universally agreed on now.

Going down a level, the point at issue is then the various palaeoclimatic reconstructions of the [[temperature record of the past thousand years]] (or, now, two thousand). Here the important point is ...the increase in temperature in the 20th century is likely to have been the largest of any century during the past 1,000 years... and so on: which you'll doubtless recognise as a quote from the TAR. But more than that, all the headline points that the TAR made about the MBH record it used are true of all the other reconstructions too. So all the nonsense about whether the fall of the Hockey Stick would disprove global warming or whatever is just nonsense. Because there is plenty of backup. The other point that the septics do their best to push is the idea that all the attribution of climate change arises from the palaeo reconstructions. That too is nonsense, & discussed at RC. Or just read the TAR.

Going another level down, we come to the various arguments about the details of the Hockey Stick. Thats the level of the recent RC post Hockey sticks: Round 27, where we discuss two recent GRL papers. This is interesting stuff - if you're keen on statistics. If you're not, and you're baffled by the claims and counter claims, then you have two options: hop back up a level, because you've got to a too specialised for your understanding; or improve your understanding. Don't misunderstand me: there is a lot of interesting work to be done at this level. There are, as shown by the graph, a whole pile of records that agree on the main points but disagree in detail. Resolving this is an active and valuable area of research. If you're interested in policy, though, you've gone too far down. Go back.

Some people think that that the debate over the so-called "hockey stick" temperature reconstruction is a distraction from the development and promulgation of climate policy. And I agree (though I would replace "policy" with "science" cos I'm more interested in the science). And this is what we've been saying in the recent comments at RC. So if anyone were, hypothetically, to enquire why *others* should continue to care about it... Why is this fight important to the rest of us? the answer is: you shouldn't. It isn't. There: that was easy.

Oops: I forgot something and blew my dramatic ending. Sigh. There is (yet another) odd inversion about: the idea that if we were to switch from, say, MBH (less variance) to Moberg (more) that would somehow imply a reduction in expected future warming. That is completely wrong. If the past temperatures varied more, it implies a *higher* sensitivity to forcing, and therefore a *higher* future change.

[Updated to fix broken href; nothing new to see; move along now folks... :-)]

2005-10-31

Our pumpkin

Here we see our pumpkin, it being halloween.

I used to rather dislike halloween, but now we're used to it its quite fun. Miranda went out; Daniel stayed in.

Elsewhere: an image of Miranda: in the dark; running; wearing a fairy costume; carrying a toy shopping trolley full of sweets.

2005-10-30

In praise of moderation

One of the reasons the various blog fora are valuable is because they moderate comments: which is to say, some are deleted/not posted. The obvious advantage is that this keeps out spam from the porno and online poker folk, rude and abusive nonsense, and the nutters. The obvious disadvantage is that none of the nutters think they are nutters and tend to whine about censorship. This is difficult: no-one is going to spend time and effort writing interesting comments if they think they will be blocked. But my spam/trolling/incivility threshold may be different to yours.

To use an example thats deliberately not the one you're thinking of, over at RC recently one John Dodds has been pushing his own wacky theories of GHE (or lack thereof...); see comments on this thread - 16, 18, etc. RC has probably been too gentle in handling him (nonetheless we (I) got bored in the end). The problem with that stuff is it disrupts the flow of sense.

James Annan suggests posting to sci.environment. If you have no proper newsfeed, go to groups.google.com and its fairly easy. Sci.env has the advantage (?) of being unmoderated, and of course it could aggregate stuff across many blogs, instead of the balkanised blogscape that exists. Why not try it? If your comments here are sufficiently valuable, post them there too, and watch them drown under a sea of junk. An interesting reverse experiment is being tried by mt, who has tried copying a posting from sci.env to his blog to try to have a more sensible debate there, but it doesn't seem to be working.

Refs

* Your comment was denied for questionable content...
* “like being inside Hansens head”
* Moderation at The Conversation - ATTP

2005-10-29

Shaken by Tossers. Or not.

Eli Rabbett is laying into Taken by Storm. He has a link to their "briefing" if you really want to read it (I found this via Tim Lambert, who provides you with a link to his earlier demolition).

But what I wanted to discuss was not their arguments, but why they have been totally ignored. And they have been. Not even the knee-jerk septics have done more than nod in their direction.

Firstly, because their idea that global mean temperature is meaningless is such obvious pap that anyone can see that.

Secondly, because their arguments to try to prop up this assertion are sufficiently convoluted that there is not the slightest chance of non-specialists understanding them.

The latter I think is important. If you want to sound off as a GW septic, you need a good sound bite that appears to make sense. Waving your glass at a party saying "of course, global temperature doesn't exist, because..." and then trying to spout pages of gobbledegook that you can't remember is just going to make you sound like a fool.

The obvious contrast is with the M&M attack on the MBH hockey stick stuff. Here, instead of trying to replace the bleedin' obvious with some subtle convolutions, they are trying to attack a fairly subtle technique and pick nits in it. This is far easier to sell, and it has.

2005-10-28

Exxonmobil title-tattle: www.europeanvoice.com

EuropeanVoice (which appears to be a business of The Economist) is running a meeting "Climate Change Now: what can Europe deliver?". The blurb sayeth;

With climate change at the top of the G8 and UK Presidency agendas, how can real progress be made in achieving the necessary reductions in CO² [sic] emissions? What can governments and industry do now to deliver cleaner solutions to our energy and transport needs?

The most recent scientific assessments suggest that the climate is changing even faster than previously thought and the pressure is even greater to develop and deliver new technologies which can dramatically reduce greenhouse gases now and in the short- to medium-term.

What more should governments be doing through fiscal or other financial measures to support R&D and innovation and help industry boost the process?

In the run-up to the COP-11 Kyoto talks in Montreal, this conference aims to assess the EU's key objectives going into the talks and policy-makers' and industry's response to the challenges.


Nothing especially weird there (though t' Economist would normally downplay recent scientific assessments suggest that the climate is changing even faster than previously thought and the pressure is even greater to develop and deliver new technologies) until you notice that the sponsor is... Exxonmobil. Exxon used to be heavily anti-GW (this from 2000 is distinctly mendacious, but still I must admit on the cautious side), now its hard to find their views. This from 2003 pushes uncertainty and says nothing really about the state of the science; not much change from 2001. And by 2005 nothing much has changed: they have no position at all on whether the world has warmed and how much it might in the future.

Perhaps they are dipping their toe in the water... to see how warm it is?

2005-10-26

Butterflies: notes for a post

[Updated: see end]

This is more in the nature of notes for a proper post, but I'll put it here. If you want to read some sense, check James Annan: still flapping. If you want some nonsense, then follow the link therein to RP :-)

But first: something completely different:


So, I took HadAM3 (64 bit version) and did two runs: one standard, and one where I perturbed the surface pressure at a single grid point (I forget where: somewhere in the Arctic I think) by a tiny amount (1e-10, or was it 1e-12?).

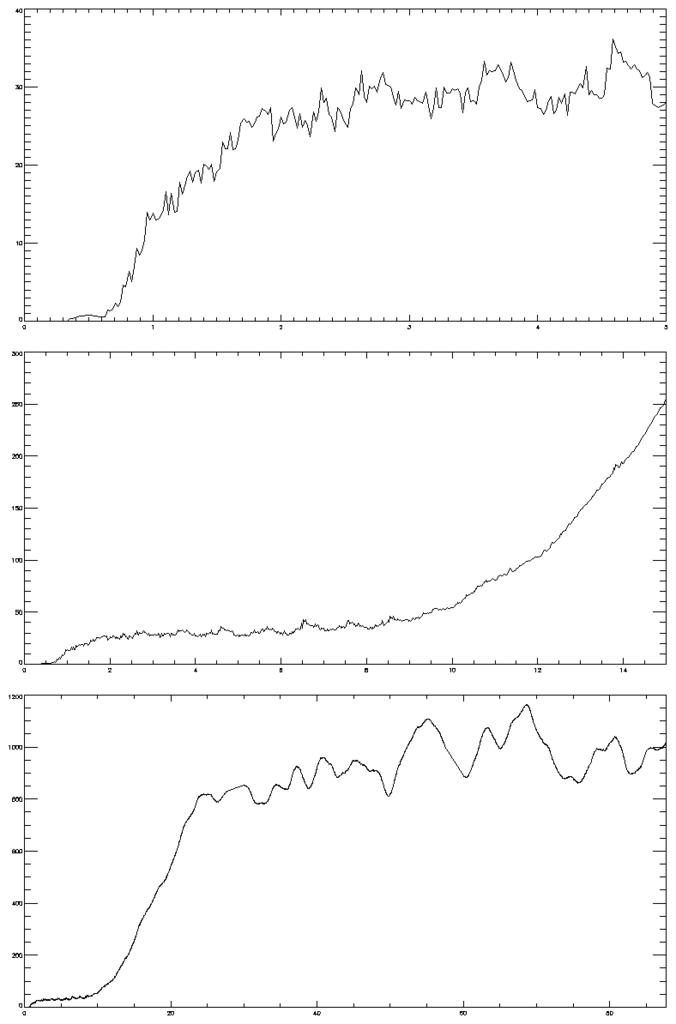
The graph below shows the growth in global-mean area-weighted RMS of the difference of the MSLP field between the two runs:


The x-axis is time in days (48 timesteps per day): 0-5 (top); then 0-15 (mid); then 0-89 (bottom). By day about 25, and definitely by day 60, the difference between the runs has saturated: their weather is totally different, so no further growth in RMS occurs. The 5-10 day oscillations in the last month are, I think, what you'd expect to see from weather evolution.

The y-axis is in Pascals. 100 Pascals is an hPa, ie 1 mb. Standard weather charts tend to plot pressure in contours of 4 hPa, so in real weather terms the diffs are sort-of negligible out to about day 15 (although this is a global value, so locally there will probably be bigger values).

There are clearly different phases in the difference growth. After day 25-ish there is a slow rise to saturation. From day about 10 to about 25 there is exponential growth. From day 2 to 10 ish there isn't much growth. And from the start to about day 1 there is another exponential phase.

If you look carefully, you'll see that the diff appears to be zero for the first few timesteps. This isn't really true. But the model output (as opposed to its internal variables) has been converted from 64 to 32 bit floats; and the difference is identically zero at 32 bit (but not 64).

Meanwhile, its interesting to look at the pattern of the diffs.


The top pic is about day 4 (in the not-much-happening phase). The middle, day 15 (in the exp growth). The bottom, day 31 (saturated). Note that the pics have a different contour interval. By days 15/31 we're into "real meteorology" and hence the MSLP field is most different in extratropics, as it always is (its tropical dynamics, folks). The fact that the biggest diffs on day 4 are in the tropics (is this convection being jigged?) says we're in a different regime, but I'm a bit unsure.

So there we are for now. Over to you, James.

[The original post was oct 15. I've updated the timestamp.

Update: I've been playing with the timestep-dependence of this. In the pic below, the black line (solid) is run "a" (std) minus run "b" (small pert); black dashed is a-c, where "c" is a different small pert. Blue is the same but for with all three runs done at 1/2 the timestep. Red also, but for 1/4 the timestep. The std timestep is half hour. There are plenty of caveats here: firstly, that this is really only playing. Secondly, that all I did was change the value marked timestep (actually, the value marked "steps per period" from 48 to 96 to 192) without checking that anything was going hideously wrong elsewhere. Thirdly, that if you compare this to the previous plot you'll notice that its spikier: because its 6-h data (instantaneous) not timestep data. Fourthly, that even if nothing is going hideously wrong, changing the timestep does give a different model (is the climatology the same? I don't know. Maybe). For example, the atmos is fourier-filtered at the poles for CFL reasons. A smaller timestep means less area if filtered.

Also: to answer JA's q: does the pert grow one-box-per-timestep (ie, unphysically?). Well no. It grows faster than that, because, ha ha, the perturbation is within the filtering zone so it grows into the entire northern polar cap within a few timesteps.

But: the plot below shows that the initial growth is *slower* with smaller timestep (well even this is complex: the 1/2 timestep run grows faster up to day 1; but then the "plateau" level reached by it is lower between days 2 and 10; and the 1/4 timestep plateau is lower again. Does this mean that a very very small timestep (arguably, as physical reality has?) would have a very low (zero?) plateau? I must try some even shorter timesteps. BUT then you end up in territory where the model was never designed for and it becomes rather dodgy.


Having 3 different runs at each timestep (more would be nice of course) allows you to see that during the day 15-30 growth phase, the timestep doesn't matter. But earlier, it clearly does.

Curious. I wonder what it means...

ps: sorry James. I'll get back to it :-(