I was going to write this the very next day, but had some odd results which took some time reconciling to reality. So this is using the Comiso (Bootstrap) data. Its also using extent, not area. And its 1979 to 2003, because the Bootstrap data at NSIDC is a bit behind the times (this is a good thing: it means its had extra QC checking for weather clearing and other stuff I don't understand).
So what does it look like? Oh, hold on... before I show you, read this:
The usual caveats apply. I've checked my pic a bit but I did this all in an hour at home tonight after spending some time worrying about Ofsted (and if you don't know what that means, consider yourself lucky), so if anything looks madly wrong to you, you may well be right.
So the pic looks like this:

What you're seeing is decadal trends, by month. In the top pic they are expressed as a percentage of the average for that month; in the bottom, they are expressed as absolute (in millions of square kilometers).
I need to emphasise one important point, which is that the Antarctic ice cover has a very strong seasonal cycle. So the percentage figures can be a bit misleading. The biggest % change is in March (the ice minimum) at about 6%; but the biggest absolute change is about 300,000 km sq in May, with a % change of only 3%. This distinction exists for the Arctic too but is rather less important, because the seasonal cycle there is smaller.
Also, if you are looking at the previous post note that the data there is Team not Bootstrap and is area not extent.
In the Arctic (refer previous post), the main features are:
- Trends are always negative (ie, losing ice) all year round
- They are largest in late summer and autumn (I would naturally say summer, but september is autumn)
In the Antarctic, the main features are:
- Trends are mostly positive, but near zero and sometimes negative in spring/summer
- They are largest in (southern hemisphere) autumn (mar-apr-may)
In absolute terms, the largest (mar-apr-may) trends are about half the Arctic ones (reading off the nsidc press release). As to (statistical) significance... my software thinks that March and May are, but only just (95%).
And spatially they look like... in March and September (scale in fraction per decade):
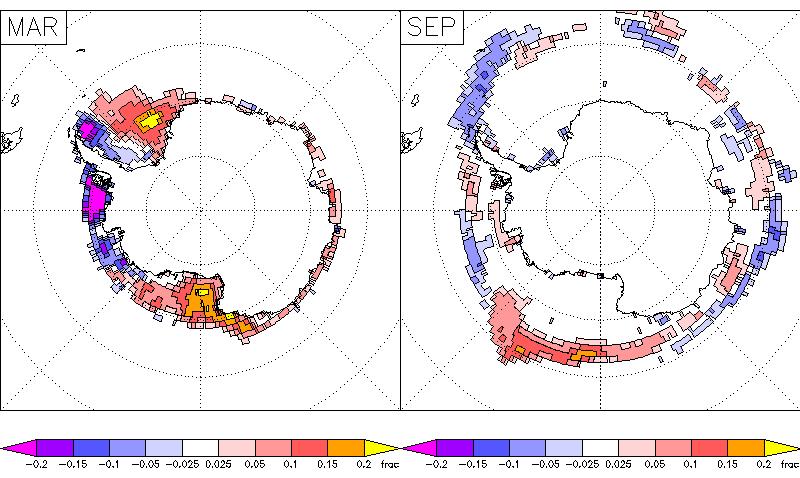
Mixed.
And what (I hear you say) about the climate interpretation of this? Well (I answer) I didn't interpret the Arctic trends and no-one complained. Perhaps because it was all obvious to everyone. You may want to read the start of this old post too.
No comments:
Post a Comment