2005-06-27

Causes of differing temperature trends in radiosonde upper air data sets

As an experiment, here are two abstracts I came across whilst browsing journals. Both are about the puzzle of upper air temperature trends. The puzzle (for those who have been asleep) is that the surface is warming, the models say the upper air should warm more, and some of the upper air series say it is but others say its not. If you're a rabid septic you take the lowest estimate of upper trends and say the sfc must be wrong; if you're a wild-eyed alarmist you take the sfc and the highest upper air estimate as gospel; if you're a scientist you admit there is a puzzle and await its resolution or write papers like those below. For my own opinion, I think that the sfc obs are probably more reliable than the upper air.

These abstracts don't resolve the puzzle. I confess, I haven't read the papers, just the abs, but it looks to me like they simply confirm the continued existence of the puzzle. What would resolve it? One of the MSU groups finding a major error in their methods or code, perhaps. The realisation that sfc and upper air don't have to follow each other on decadal timescales - this would reconcile sfc and lowest upper air estimates, but would leave the various MSU records still conflicting. Something else? We shall see.

Causes of differing temperature trends in radiosonde upper air data sets; Free M, Seidel DJ, JGR-A, 110 (D7): art. no. D07101 APR 6 2005

Differences between trends in different radiosonde temperature products resulting from the varying choices made by the developers of the data sets create obstacles for use of those products in climate change detection and attribution. To clarify the causes of these differences, one must examine results using a common subset of locations to minimize spatial sampling effects. When this is done for the Lanzante-Klein-Seidel (LKS) and Hadley Center (HadRT) radiosonde data sets, differences are reduced by at least one third. Differing homogeneity adjustment methods and differences in the source data are both important factors contributing to the remaining discrepancies. In contrast, subsampling the microwave sounding unit (MSU) satellite data sets according to the radiosonde coverage does not generally bring the trends in the satellite data closer to those in the radiosonde data so that adjustments and other processing differences appear to be the predominant sources of satellite-radiosonde discrepancies. Experiments in which we subsample globally complete data sets provide additional insight into the role of sampling errors. In the troposphere, spatial sampling errors are frequently comparable to the trends for 1979 1997, while in the stratosphere the errors are generally small relative to the trends. Sampling effects estimated from National Centers for Environmental Prediction reanalysis and MSU satellite data for seven actual radiosonde networks show little consistent relation between sampling error and network size. These results may have significant implications for the design of future climate monitoring networks. However, estimates of sampling effects using the reanalysis and the satellite data sets differ noticeably from each other and from effects estimated from actual radiosonde data, suggesting that these globally complete data sets may not fully reproduce actual sampling effects.


And another one, with a star cast of authors from the Tropospheric world, including Christy and Wentz, Angell and Parker; Free as above...

Uncertainty in signals of large-scale climate variations in radiosonde and satellite upper-air temperature datasets ; Seidel DJ, Angell JK, Christy J, Free M, Klein SA, Lanzante JR, Mears C, Parker D, Schabel M, Spencer R, Sterin A, Thorne P, Wentz F, J. Climate, 17 (11): 2225-2240 JUN 2004

There is no single reference dataset of long-term global upper-air temperature observations, although several groups have developed datasets from radiosonde and satellite observations for climate-monitoring purposes. The existence of multiple data products allows for exploration of the uncertainty in signals of climate variations and change. This paper examines eight upper-air temperature datasets and quantifies the magnitude and uncertainty of various climate signals, including stratospheric quasi-biennial oscillation (QBO) and tropospheric ENSO signals, stratospheric warming following three major volcanic eruptions, the abrupt tropospheric warming of 1976-77, and multidecadal temperature trends. Uncertainty estimates are based both on the spread of signal estimates from the different observational datasets and on the inherent statistical uncertainties of the signal in any individual dataset.

The large spread among trend estimates suggests that using multiple datasets to characterize large-scale upper-air temperature trends gives a more complete characterization of their uncertainty than reliance on a single dataset. For other climate signals, there is value in using more than one dataset, because signal strengths vary. However, the purely statistical uncertainty of the signal in individual datasets is large enough to effectively encompass the spread among datasets. This result supports the notion of an 11th climate-monitoring principle, augmenting the 10 principles that have now been generally accepted ( although not generally implemented) by the climate community. This 11th principle calls for monitoring key climate variables with multiple, independent observing systems for measuring the variable, and multiple, independent groups analyzing the data.

2005-06-25

Honey and Hayfever/Asthma

Quite a few of the people who buy honey from me do it because of the theory that eating local honey is a remedy for hayfever/asthma. The idea is that the pollen in local honey in some way immunises you, or perhaps that it makes the body less likely to react to it. Its a plausible thoery, and may even be true, though I never actually use it to advertise because it probably amounts to making unsustainable medical claims.

2005-06-23

Galileo: Dialogue concerning the two chief world systems: magnetism

I've been reading the "Dialogue concnerning the two chief world systems" by Galileo (see-also: wiki). I've got to the end of day 3 (of 4). Day 4 is apparently about G's (incorrect) theory of the tides, which may well be an interesting thing in itself. Apparently, he was so keen to prove that the earth moved, that he rejected the idea of "influences" from other bodies (the moon) in favour of a theory that (he thought) demonstrated directly what he wanted to prove.

There is a motto in that, of course... but I'll talk about a bit that I have actually read: magnetism. Which comes at the end of the third day. I wanted to point you to an online source, but sadly it the "full" texts I found all omit that bit as peripheral to the Copernican/Ptolemaic dialogue which is the main purpose.

Anyway... they are talking about Gilberts theory, which was that the Earth is a giant lodestone. Which of course we now know to be wrong. Although arguably its close enough. Anyway, the point is, that G points out various things about lodestones, ostensibly from observation. Some of these are true: that the attraction is greater at each end and falls to zero in the middle. That it points N-S (incidentally, I see no evidence that he realised it didn't point to true north). He also notes the fairly new observation of the dip of the lodestone - ie, that if free to pivot vertically, it doesn't stay horizontal but dips, according to latitude. But here he gets a bit weird. He asserts that the southern pole of the magnet is stronger. He asserts this, because he explains the dip by the greater strength of the S pole (isn't this wrong? doesn't a magnet dip with N pole downwards in the NH?). Then a bit later on he says of course, this strength changes, with no difference at the equator and at the pole a magnet stands vertical (this latter "fact" was of course unobserved, despite being presented as an observation). Now it seems pretty weird to write it this way (in terms of changes in strength of the magnet) when an explanation in terms of following-lines-of-force is fairly easy (but did he know about that? He talks of lodestones attracting iron filings, but *doesn't mention putting a lodestone under a sheet of paper and sprinkling filings on top to visualise the lines. Also, (of course?) had he actualy measured the load-bearing strength of each end he would have found it the same.

So... the motto I was going to draw from this was that small flaws in peripheral areas don't invalidate your main argument :-)

2005-06-19

Comment on sci.env!

I've just noticed that James Annan has this:
Comments are welcome, but I don't expect (or wish) substantial debate here. Please go to news://sci.environment where all can contribute. (You'll probably want a proper newsreader with a killfile though)
I think James is substantially right about this, for any number of reasons, most of them obvious. I'm talking about the science posts, of course. The interspersed beekeeping and stuff is fine here. And of course, if you *want* to comment here, thats fine as well. But commenting on sci.env has a number of advantages:

* No one owns it. I can't censor your comments, and so you don't get to post absurd comments complaining about censorship.
* Lots more people will see your comments, most likely.
* It just works better as a forum for dialogue. Blogs just aren't very good at that.

I read sci.env (so does JA) so I'll see any comments there as soon as I see them here. I suppose, to be fair, I ought to point out the disadvantage of sci.env, which is the high bozo coefficient, but nothing is perfect (apart from the weather on this fine evening, which has cooled down from absurdly hot during the day to very pleasant an hour after sunset, with a new full moon low to the south).

Any comments? :-)

2005-06-17

Betting on climate change... or not?

Betting on climate change is the new meme. Everyone is doing it... or rather, everyone is posting about it. But the septics are shy. The "king" of the bets is James Annan: he has a nice summary of the bets here and a pile of links to others on the subject which I won't replicate. James is (as far as I know) the only person to have actually presented work at a scientific conference on the issue (poster pdf here). He has a long series of skeptics who have failed to back up their words with money, or who have shuffled their words when challenged. James wrote up a post for RC (here) which I think holds the record for the most comments, certainly in the shortest time. Roger Pielke has a post too (in fact he just beat us to posting, but ours was under review...). And there is a Reason mag article (which contains an amusing disclaimer wrt me, but its trivia, as you'll know if you saw the original) (which has now vanished; Reason are shit at keeping their old posts visible; here's an Internet Archive of it; or, if you prefer, the first version with the error about me and Lindzen, and  - unforgiveably - mis-spelling my name). The Reason piece is worth reading, if only for the frisson between the reporter, who clearly feels rather let down by Lindzen and is obliged to say that he somehow misheard or misunderstood Lindzen (over the 50/50 warming/cooling, which is unsupportable). It has been a very interesting process (and probably not finished yet). Who would have thought that Michaels estimates for future change are actually within the IPCC limits? That sets an interesting challenge: how to refine the bets to pick him up more precisely? There is a tension as to the most desireable length for a bet. Obviously, going one or a few years ahead only is silly: natural variability means you can't predict individual years. Going too far ahead isn't good either: by 2100 most people reading this will be dead (unless my words last rather long than I expect them to); and predictions out to 2100 are more dependent on future CO2 emissions (ie, economics) rather than climate sensitivity (ie, climate science). James has focussed on predictions to 2030 and this seems sensible: its quite a long way out, but we'll still be alive (JA refers to it as funding his retirement, but I'm a bit older...) we hope. Further, predictions to 2030 are rather less sensitive to future CO2 emissions (being more conditioned by current levels and committed warming). OTOH 2030 still leaves the possibility of the "wrong" answer due to natural variability, but you have to live with a small risk of this. So, hopefully people will take up on James bets. If enough money pours into him that he runs out of ante, I'll be happy to fund his part of his bets. Perhaps we could even get a syndicate together. But at the moment, he lacks someone to bet against.

"We don't even know how many legs he's got"

FB_IMG_1729841509917 This one is a brief foray into politics: the War in Iraq:

There is an article in the current Economist, which is rather downbeat on the Great War, although they have been pro-war boosters all along. It contains the wonderful:

"Who would die so wantonly? It beats American intelligence officers. Asked about Abu Musab al-Zarqawi, a notorious - and, according to some reports, one-legged - Jordanian fanatic, a senior American official admitted, "We don't even know how many legs he's got."

You have to laugh, or you'd cry. If you want reasons for the latter, visit the "Lancet study" section of the new-look Tim Lambert, which not only tells you how many excess Iraqi deaths we've caused, but also shows to what lengths people will go to avoid knowing it.

2005-06-15

Antarctica and sea level rise

There's a convoluted post over at World Climate Report. Its about the recent Science paper (Davis, C.H., et al., 2005. Snowfall-driven growth in East Antarctic ice sheet mitigates recent sea-level rise. SciencExpress, May 19, 2005.). This paper tells us that East Antarctica elevation is increasing, probably because its gaining mass. Thats exactly what global warming tells us should happen, and of course its factored into the IPCC predictions of sea level rise (chapter 11). The WCR post content is so badly distorted by its presentation that I thought I'd try to interpret it here.

So: E Ant is getting bigger; fair enough. What WCR don't point out is that this is only a small fraction of the SLR from other sources, mainly thermal expansion. As far as can be told, its just about balanced by Greenland melting (at the moment, and very roughly into the future too).

They also attempt some kind of counterpoint against the warming/melting on the Antarctic peninsula and/or West Antarctica. Weeelllll... the main point about the Peninsula stuff is that it is a sudden dramatic warming with consequences (locally). The impact on SLR is small though. The point about West Antarctica is that there is potentially a lot of SLR in there. Current best-guess is that its going to stay potential, with an unknown chance (10%? 5%? take your own guess) of a nasty surprise of 1-2 m of SLR from some kind of surge over... 1 century? 2? Take your own guess again.

2005-06-13

Fluid dynamics: honey spirals

When straining my honey, I observed that the long thin stream of honey falling into the pan doesn't just fall straight down, or flop randomly, no, it arranges itself into tidy spirals. See pix:


Isn't that pretty? It looks like glass. Its not a steady state: the tower builds up, then the weight gets too much for it, and it semi-collapses down, then builds again. The tower is about 1 inch high (metric? pah!), the fall of the whole stream from the strainer about 1-2 feet, and the build-shrink cycle about 1-3 seconds, though it changes as the honey stream slowly thins out. Its not caused by motion at the top of the stream, which is steady, as is the whole stream until just above where it curves off.

2005-06-12

Speculation: the need for science?

I knew there was something else I meant to say about the naughty Bush people, and this is it...

How much does it matter if the US "elite" believe in science or not? Will it work if they only believe in some bits? (I'm using "elite" in quotes to mean whatever-I-want-it-to-mean, of course).

It looks to me that a lot of people are complaining about the Bush executive's attitude to science, which appears to be to censor and/or obstruct anything they dislike or find inconvenient. I'm thinking about climate change, cos thats the bit I'm familiar with (although its not a great example, as any harm doesn't fall particularly on one country), but there are other isses (stem cells (I don't even know what they are...), Creationism, etc etc).

On these issues, science is telling Bush (OK, I'm going to say "Bush" from now on...; map him to a broader group in your mind) things he doesn't want to know. So he pushes away that bit of science. The problem is that doing this with an increasing array of different bits of science will leave him (if he is successful in hanging on) with the idea that this works.

Now I (and many other people) would argue that much of the material prosperity of modern industrial society is built on science/engineering, which simply doesn't work if you push away inconvenient facts. If your widget factory is making deformed widgets, its no good holding a commission of inquiry, then appointing some uncredentialled person to scrawl all over its findinsg, and conclude that the uncertainties are such that its possible some of the widgets are OK. They'll just stop working and if you do this enough your society will grind to a halt.

But... is it possible to envisage a situation where the wacko "elite" all believe in God, Creationism, no Global Warming, etc etc, and yet underneath there is a layer of technology that keeps working, keeps creating, and keeps your society ahead? Perhaps, if they let the underlayer alone, but they wouldn't. The creationists would interfere with the schools and universities. Can you really do genetics if you believe in creationism? (this is possibly a testable question: *are* there any genetics researchers out there (of any quality) who are known creationists?).

Well, I don't know, just thinking aloud. My other Great Theory about the collapse of the US is that it will decay under the weight of lawyers.

2005-06-11

Cooney goes

The Bush folk have been naughty again, once again watering their science with politics, as the NYT discovered; Quark Soup has links to scans of the memos themselves.

According to the R4 10 o'clock news, Cooney has resigned/been sacked or something (and the NYT agrees). The Whitehouse apparently insists that this is nothing at all to do with the memos, but its unlikely that they expect anyone to believe that [1].

2005-06-10

Cactus flowers and swarms

[Note: this is the old blog. The latest cactus-related stuff on the new blog is http://scienceblogs.com/stoat/2010/05/cactus.php -W]

Every now and again the cactus that lives in a sunny spot at the top of our stairwell (just next to the sadly unwashed window...) flowers. The flowerings are rare - less than once a year - and suddenly I notice that the scruffy old dusty plant is briefly beautiful. perhaps I should sent it back to its native desert to live with JF...


The plant has a history: it was given to my grandad by my uncle; both are now dead, so the cactus is in memory of both of them.

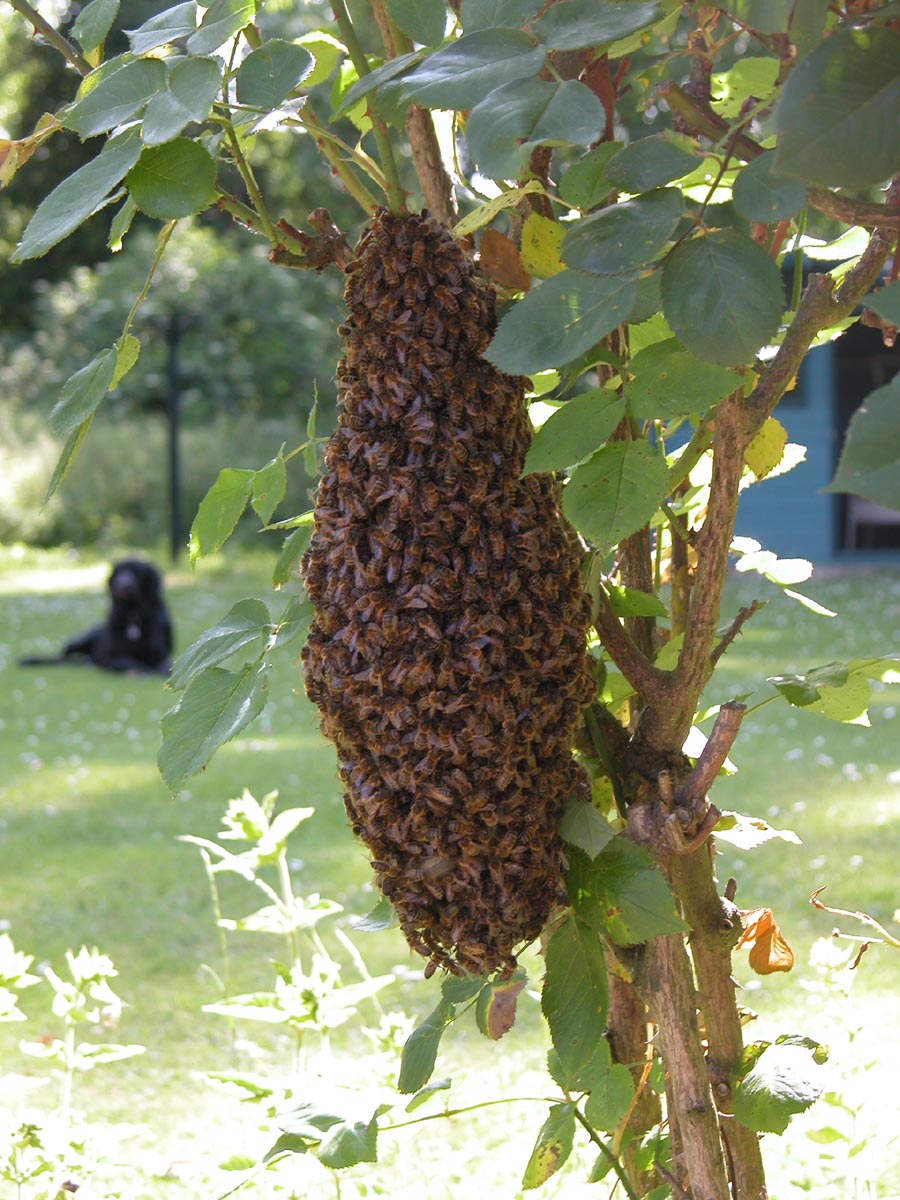
Meanwhile, I got called out to a late swarm of bees, at the local Big House (well, the ex-rectory). Here they are:


A bit scrawny for a swarm. The dog in the background didn't quite know what was going on. Anyway, into a box they went and I found someone who wanted them. We have a surfeit of green plastic kitchen waste bins around, which make nice bee-proof containers, so (after sellotaping it shut) I was able to walk into their house, swinging the bucket around (carefully...) saying "anyone want a box o' bees?" and the children put their ears to it to hear the bees buzzing.

The next day the people at the house gave me some of their eggs, and a bottle of wine, in exchange for clearing the bees for them. No one has ever done that before! Normally, its not quite clear whether I'm doing them a favour or not: they are grateful for the bees removal, but they kind of suspect that they are my bees in the first place. Which, sometimes, they are.

Serendipitous Epiphenomena

A plug for a friends blog... MC has the good sense to choose uncommon words for his blog name, so gets to be google #1 for the two-word combo, and perhaps surprisingly #2 for "epiphenomena". See New technology will save the environment... for a rather fun cartoon. And elsewhere there for some other cartoons, and even some interesting words... I liked the Trix bit.

2005-06-09

Climate is stable in the absence of external perturbation

I think that the climate (specifically the Holocene climate, ie since the end of the last ice age) is stable: ie, there are no chaotic swings or wild jumps. You can't say the same for the last glacial period, because there *are* large swings called Dansgaard-Oeschger events and perhaps more. Those jumps are (probably) linked to the Laurentide ice sheet, so its just possible to finangle it by making the ice sheet an external forcing, but that could be considered cheating. Anyway, I'm talking about now, not then.

Of course, this isn't a very novel view: if the climate wasn't stable and responding fairly smoothly to imposed perturbations, then you couldn't attempt to predict it. So the-climate-is-stable is the view, probably without ever having considered it terribly carefully, of most climate scientists.

But, of course, you get skeptics saying: if you can't predict the weather a week in advance... (all together now)... How can we predict the climate 100 years in advance?. There are lots of answers to this: the most obvious are in the previous post: another one is: weather and climate are different. Thats why they have different names.

So: what is climate? A question not often bothered with. The answer is, something like, the statistics of weather. So this includes the 30-year running mean that is the older "definition" of climate; as well as the year-to-year variability. For example, if you look at the temperature record then you see that the interannual variability has remained about constant over the past 120 years of the instrumental record. The same page shows that the average (global/hemispheric) temperature has (excluding the most recent GHG forced episode) stayed within +/- 0.5 oC of a mean value over the past 2000 years. Thats really quite stable.

So what transforms a chaotic system (weather) into a stable system (climate)? Averaging, of course. Predicting the temperature on any given day of next summer is impossible: predicting an average summer temperature is easier; predicting a 10-year mean is easier still. There will probably be, next summer in the UK, one day that is colder than the warmest day of next winter (which is itself a stable climate statistic, of course its one that I've made up off the top of my head but its quite likely true...). However, next summer will certainly be warmer than next winter. Note that the famous "year without a summer" wasn't a chaotic fluctuation: it was a response to an external perturbation, viz the volcano Tambora.

Its possible to produce a simple model of this, the Lorenz equations/attractor: the famous butterfly shape. For the rest of this para I'm relying purely on memory, so please correct me, but: the Lorenz equations lead to chaotic trajectories, ie initially close trajectories diverge. But: the overall PDF (probability density function) of particle-location is perfectly stable (and bimodal) if you average. You can modify the equations to include a forcing term: this results in shifting the PDF so the particle sits in one of the wings more often than the other, but is nonetheless a smooth response to the forcing. This is all Tim Palmers stuff, and he wrote it up nicely in weather some time (his point was, that climate change could be more about different residence times in various modes than shifts in the modes themselves). If anyone (JA?) can point me to a decent set of refs for this bit, I'd be grateful...

What about large scale shifts like the ice age cycle? These appear to be regular, and linked to orbital forcing, so count as responses to external forcing (albeit with internal feedbacks amplifying it). Even some of the variability of the last 2kyr comes into the forced category, though its not clear yet quite how much: bits of the so-called MWP/LIA may be.

Of course people *do* worry about is the possibility of chaotic shifts: the shutdown of the THC could come into this class. Methane clathrates could, too. But at the moment, AOGCMs don't produce chaotic THC shifts that simpler models do. This could be a flaw in the GCMs. Or they may be right.

Yet more stoats

If #7 wasn't enough, you can be even more stoaty here (thanks JA, even if he prefers waffle).

We'll return to the science shortly, with the return of that old favourite, "is the climate system stable (in the absence of external perturbation)?". I shall be arguing "yes" (i.e., it isn't chaotic). If you disagree, comment your objections quickly and I'll rip their throats out (sorry, back to the stoats).

David Bellamy sacked by CAT

James Annan's Empty Blog becomes steadily less empty, mostly with the interesting betting-on-climate stuff, and also picks up on something I'd totally missed, viz that David Bellamy has been sacked by CAT for talking nonsense about GW (actually it probably wasn't that particular thing, but the more recent rubbish about glaciers where he got shredded by Monbiot). CAT say: "...Some of Prof Bellamy’s recent published statements seem to be flying in the face of the considered opinion of the majority of the scientific community...". Well yes indeed. Will the wildlife trusts follow? Or (better, but less likely) will Bellamy actually start talking sense?

2005-06-08

I'm #7!

I'm the number 7 (of 89,500) google hit for "stoat" (this is a bit disappointing: yesterday I was #6...).

DA is #6 for Quark, and TL is #1 for Deltoid, though.

2005-06-07

Michael Howard says: The Tories and the US have done better than Blair on climate change

A while ago I commented on the UK govt record on climate change (by which I meant the current labour govt), and concluded the rhetoric has been good but the action disappointing.

Now Michael Howard (Tory lame-duck leader of the opposition) has written an article for the Grauniad And what if the sceptics are wrong? The Tories and the US have done better than Blair on climate change , which starts: Climate change is one of mankind's greatest challenges. In the past 30 years world temperatures have increased by almost 0.5C. We cannot predict with certainty what will happen now, but the risk of abrupt climate change certainly exists. Human activity is increasing the concentration of carbon dioxide and other greenhouse gases to levels unprecedented in human history. If we do nothing, or next to nothing, those levels will continue to rise, progressively increasing the risk of runaway global warming. I'm a bit dubious about the abrupt/runaway stuff, but again: its good rhetoric.

Howard gets a bit carried away praising local US initiatives, but this is mostly because he doesn't want to criticise the US and wants to say The American people have shown that not being a signatory [to Kyoto] need not stop one from making progress on climate change. Sadly, Tony Blair has proven the corollary: being a signatory does not guarantee progress.

MH (correctly) points out that the UKs major CO2 cuts came from the dash-for-gas (replacement of a lot of coal powered plants by gas) under the Tories. But... he is wrong to imply that this was done for the purpose. AFAIK it was done because the Tories didn't like the power of the coal miners and were keen to see it reduced.

There is more good rhetoric in the article, and I suppose its good to see all the major political parties in the UK committed, in theory, to reducing CO2. But... despite all the cheerful political knockabout, there isn't much in the way of concrete plans for reducing our emissions in the article. So I fear that my verdict on him is no better than on Blair.

2005-06-05

Should I kiss the vipers fang / Or herald loud the death of man?

A miscellaneous posting with no science whatsoever.

I've been on hols


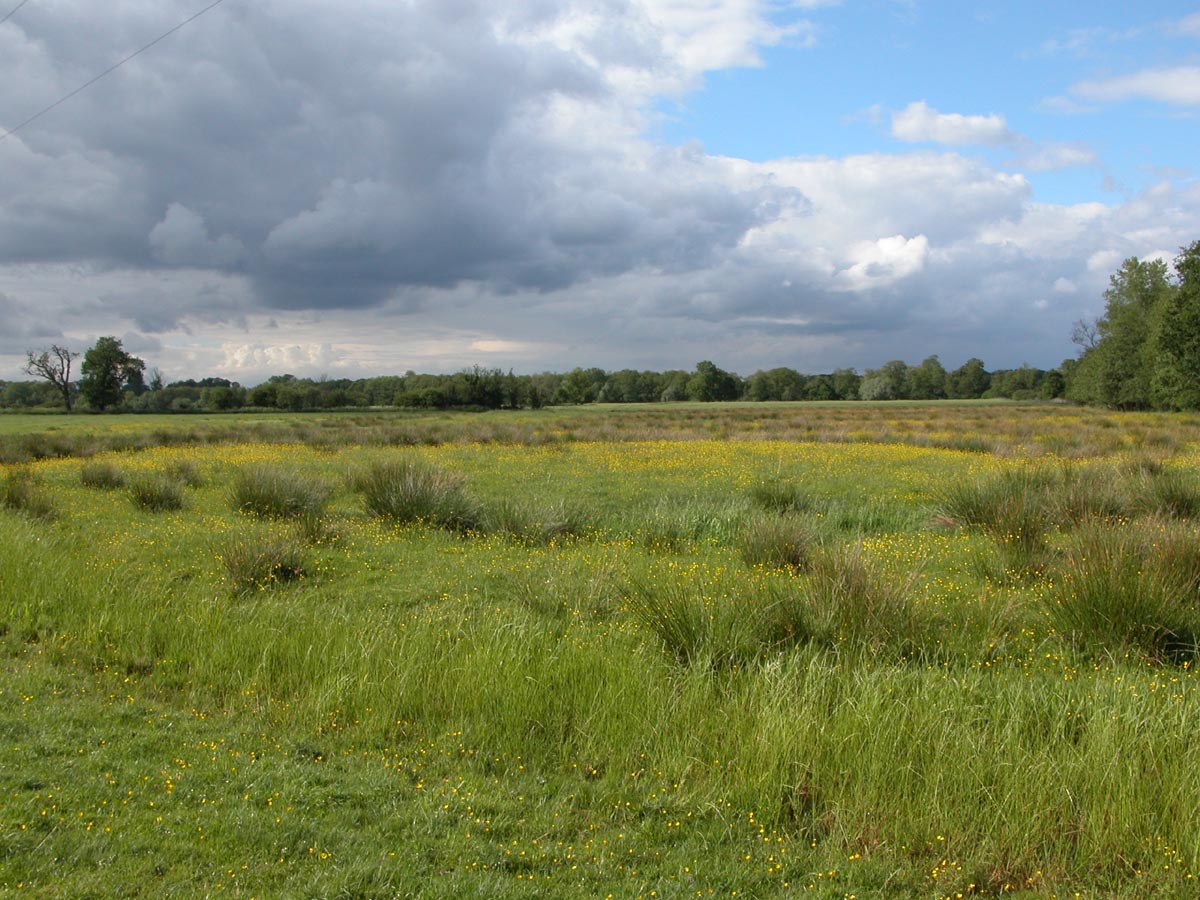
First narrowboating on the Cam, the Ouse (and briefly the Lark) on Zinfandel (slight disclaimer: the owners are friends); the pic is of the maze at the foot of the West tower of Ely cathedral; the "ghost" is Miranda. Second, camping at the Dower House campsite with friends (M stayed at home for this); the pic is of a rough pasture on the way to the hard-to-find river.

Comments


Blogger comment software is cr*p. If you post a comment, I get an email. *But* it doesn't tell me on what post. So if you post to a recent one, thats fine, I'll find it. If you post to an old obscure one, I won't. So if you want an answer and you're posting on an old post, please include some hint as to the title or subject (obscure comments like "haven't you heard of photosynthesis" aren't much of a hint; OTOH its probably not worth responding to either).

OTOH #2, you may prefer to just copy the post or your comment to sci.env: I read that, and then at least we can skip the tedious complaints of censorship.

Traffic


I'm a bit puzzled by the traffic stats. I post nothing for a week and end up with quite a few visits (they normally tail off if I don't post (which also somewhat puzzles me, cos how do people know I'm not posting if they don't visit...)) and... a practically doubled advertising income, now above the not-at-all-magic $7 mark. Saturday got me $2.86, wow.


Memes


Lastly, the title is of course Bowie, and is in response to Music Meme from TL (which was in turn...). And the answers are:


  1. Not much, just a bootleg of "The Drowned Lovers" copied from my video of Kate Rusby at the Folk Festival a few years ago as a test. Its about the only song of hers I really like.
  2. Changes.
  3. Not sure, it was some time ago. M got me "Open Season" by British Sea Power, which I've come to like, and of course includes the now-classic "Oh Larsen B" (amusingly, my post is now google hit #2 for that string).
  4. A bit tricky, since I don't have an iPod or an iStoat and I tend to leave the same album in for a week or more. Which for the last week has been Hunky Dory, and the previous week Scary Monsters, since I'm having a Bowie revival. So picking my favourites from these:

    • Its no game (part I; Japanese bits for JA...)
    • Teenage wildlife
    • Kingdom come
    • Quicksand
    • Bewlay brothers
    • Life on Mars?
    • Rambling Sailor (which comes in two rather different versions: a and b. B is the version I'm used to. And, err, yes, this isn't Bowie, its Spiers/Boden sort of, but that was on for a month a while back)

  5. I too will pass...

2005-05-29

Sea ice: What I do in my spare time :-)

In the small amount of spare time I have in between blogging, editing wikipedia, posting to sci.env, bringing up two children and looking after the garden and occaisionally talking to my wife and... so on... I sometimes manage to find some time to do actual real work. And this post is about that.

Also: I (and others) frequently decry the medias habit of only reporting sensationalised science; yet I think I probably spend most of this blog discussing such myself. Admittedly in an attempt to explain rather than sensationalise. But as a (possibly rather boring) antidote, here I shall discuss my most recent paper: Connolley, W. M. Sea ice concentrations in the Weddell Sea: A comparison of SSM/I, ULS, and GCM data. GEOPHYSICAL RESEARCH LETTERS 32 (7): art. no. L07501 APR 2 2005. The figures here are taken from the paper.

So: the issue: we run coupled ocean-atmosphere GCMs, which produce (amongst many other things) a field of sea ice concentration and depth in both hemispheres, and we would like to know whether they are right or not. I only do the SH. A simplifying factor there is that we have so few observations of sea ice depth that there is rather little hope of verifying the model depths, so we can stick to ice concentration, which since 1979 has been observed by satellite (there are earlier obs by sat, since 1973, but pretty well everyone agrees that these can't be merged consistently into the later series). This is done by SSMR/SSMI, which is special sensor microwave radiometer or imager, and you can read more about it at wiki. Basically you observe the upwelling microwave radiation in a couple of frequency bands (microwaves are good because they mostly go through clouds and stuff), and their horizontal and vertical polarisation, and from various ratios you then have a quantity that can be related to sea ice concentration. This then gives you a daily field of sea ice concentration.

But, there is more than one way to do this. There are various issues (weather filters, tie points, etc etc) but the man point is that there are two main algorithms, viz the Bootstrap and the NASA Team (there are lots of others too: change the tie points and you can have your own. But its chosing what to ratio to what that is more interesting). I won't tell you the technical differences for the very good reason that I can't remember them. There is (rather well hidden underneath) some politics in all this: and if you probe people carefully they tend to tell you that intercomparisons favour the Bootstrap, but since people had worked on Team that they weren't about to give it up. Certainly the intercomparison papers I read and ref'd in the paper favour Bootstrap, but, err, they were written by the Bootstrap authors. OTOH if the Team folks wrote similar intercomparisons I failed to find them.

Anyway: the other thing about Team is that until fairly recently it was the only one I had access too, and that my model (HadCM3) produced sea ice that had higher ice concentrations than Team (it also produced ice in a pattern around Antarctica that was somewhat wrong, but for the purposes of this I'm going to ignore the pattern and talk only about the concentration). Then I got access to Bootstrap and discovered that Bootstrap concentrations were higher than Team (though still a bit less than HadCM3). Imagine my delight: we could abandon those efforts to make the model produce less ice and just change the obs. But... this is a bit unsatisfying. We need some obs to verify the obs. So bring on... ULS (upward looking sonar) which sit under the sea for a year or two, going "ping!" every now and again and (after being retrieved and a whole pile of clever data processing to remove wave heights etc) producing a signal for "is there any ice above me" every 5 mins or so. Which can be averaged, over a month, into an ice concentration at a point. And there were about 8 of them in the Weddell sea - see pic. So, spiffy, we can compare them to the Bootstrap and Team data.

Incidentally, note that this is a thing that happens: I didn't set out to write a ppaer about different sea ice concentration datasets, it just became obvious that I needed to know about this to validate the model and (inconveniently) no one else had done it already.

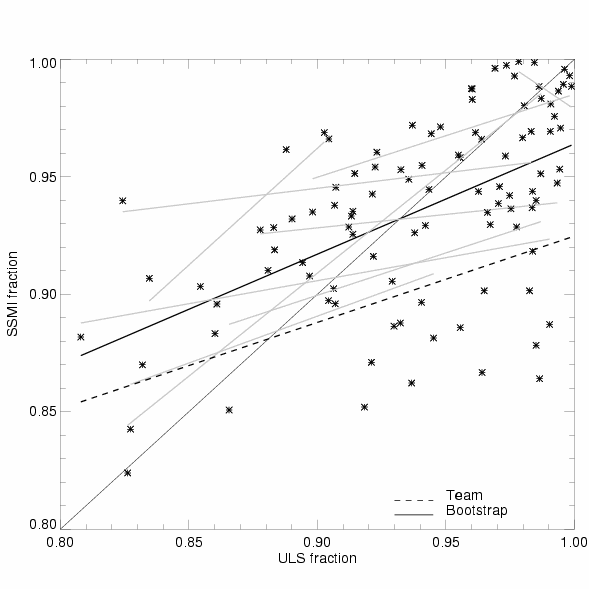
And... we discover that the ULS doesn't fit brilliantly to Team *or* Bootstrap, but it does fit better to Bootstrap. The pic is a scatter plot, with ULS values on the x axis and SSMI (contemporaneous and colocated) on the y. The one-to-one line is where we want all the points to be. The thicker dashed line is a least-squares fit of all these points, using Bootstrap data. The thinner dashed is for Team (and to confuse you, the points are not plotted for Team, just the line). The grey (gray?) lines are what happens when you do the least-squares fitting at just the individual ULS's, instead of aggregating them.

On the whole, I (and most people I spoke to) tend to assume that the ULSs are probably right, and therefore interpret the scatter on the plot as a measure of the SSMI retrieval being wrong. OTOH, there is a difficulty in meshing the ULS (point measurements with fine temporal resolution averaged up to monthly scale) to the SSMI (which has a 25 km^2 footprint, which I've averaged up to about 100 km^2, and is daily but I've averaged up to monthly). Quite how much scatter you expect from this, if the ULS and SSMI were both exactly "right", I don't know. But I haven't yet found a good reason why there should be a *bias* between them (ie, why the dashed line on the plot isn't 1-to-1). If you know a good reason, its safe to tell me: the paper is now published, and any new ideas can be fed into a new publication :-).

So the end result of all this? The paper says that sea ice concentrations, at least in the Weddell sea, are probably higher than most people thought they were, and quite possibly even higher than Bootstrap says. And that consequently we can stop worrying much about HadCM3 concentrations. Sadly, it looks like HadGEM concentrations are rather lower... but you can't have everything.

ps: I've decided I'm vaguely keen on explaining my work, so, if anything in the above is not explained, baffling, obviously wrong, whatever, do feel free to comment and I'll try to expand.

2005-05-27

Tackling Climate Change in Cambridgeshire

Tackling Climate Change in Cambridgeshire is a report (pdf) for Cambridge County Council. Its interesting to see stuff coming down to our local level. But is it any good? Surprisingly, yes: at least on the words. They also have long lists of actions but I rather suspect that the cumulative total might be small.

(BTW, I've abandoned the "more" stuff... it was too annoying).

Point number 1, they get the science pretty well right (The average global surface temperature has increased by about 0.6°C in the last 100 years, and there is strong evidence that most of the warming over the last 50 years has been caused by man. This is mainly because of the release of greenhouse gases leading to an ‘enhanced’ greenhouse effect. The gases accumulate in the atmosphere and remain there for many years, driving climate change. Scientists think that if we do not limit the release of these gases, temperatures around the world could rise by between 2° and 6°C by 2100). Perhaps this isn't too surprising - septics have got nowhere in UK climate science or govt science policy making, or even in general policy making (see my prev analysis here). They are only present by default in that the UK govt action doesn't really measure up to the words.

Point number 2, they tell you where Cambridgeshires CO2 comes from, via an analysis by CERC (who?). And the answer is, as of 2002: electricity 32%; waste 16%; transport 16%; manufacturing and construction 12%; residential 10%; industrial 6%; agriculture 5%; commercial/institutional 3%. This isn't quite as useful as it could be, because presumably the "electricity" term would be better split up amongst the various classes of users. In fact... is this data presented as you would want it? Shouldn't it be split amongst the user classes (residential/ind/ag/manuf/commerce) and then the three "creation" classes waste/elec/transp (with heating and lighting then needing to be extra classes). Anyway, we end up with 15 tonnes/person/year.

So what about the action bit? They have decided to adopt the "ambitious" target of 20% less than 1997, by 2010, which is the same as the national targe, which... err... we're not going to make. They also promise to "work towards" a 60% reduction target. Hmm. The council is going to do things to its own energy usage. It buys a lot of its electricity (80%) from renewable suppliers. It designs in energy efficiency into new buildings. It runs some vehicles on LPG (which is says is both cheaper and produces 20% less CO2). It makes efforts to avoid its staff having to drive (though moving its HQ out to Cambourne didn't help me: I used to cycle when it was in Cambridge, now I must drive. To be fair, now I think of it, it was South cambs that moved, not the County, which is still inside Cambridge). And much more, if you read the report. But... there isn't a lot to say quite how this is going to get them to their county-wide 20%-less-by-2010 target. Which is only 5 years away.

Theres also a section on "adaption", where again they get the science right, in that they notice that even present levels commit us to more climate change in the future.

So... all in all quite good words, time will tell for the action.