What it the Big Picture? From the point of view of climate change, the top level is
The world is getting warmer, we're causing it, and it will continue to get warmer in the future. This is pretty well universally agreed on now.
 Going down a level, the point at issue is then the various palaeoclimatic reconstructions of the [[temperature record of the past thousand years]] (or, now, two thousand). Here the important point is ...the increase in temperature in the 20th century is likely to have been the largest of any century during the past 1,000 years... and so on: which you'll doubtless recognise as a quote from the TAR. But more than that, all the headline points that the TAR made about the MBH record it used are true of all the other reconstructions too. So all the nonsense about whether the fall of the Hockey Stick would disprove global warming or whatever is just nonsense. Because there is plenty of backup. The other point that the septics do their best to push is the idea that all the attribution of climate change arises from the palaeo reconstructions. That too is nonsense, & discussed at RC. Or just read the TAR.
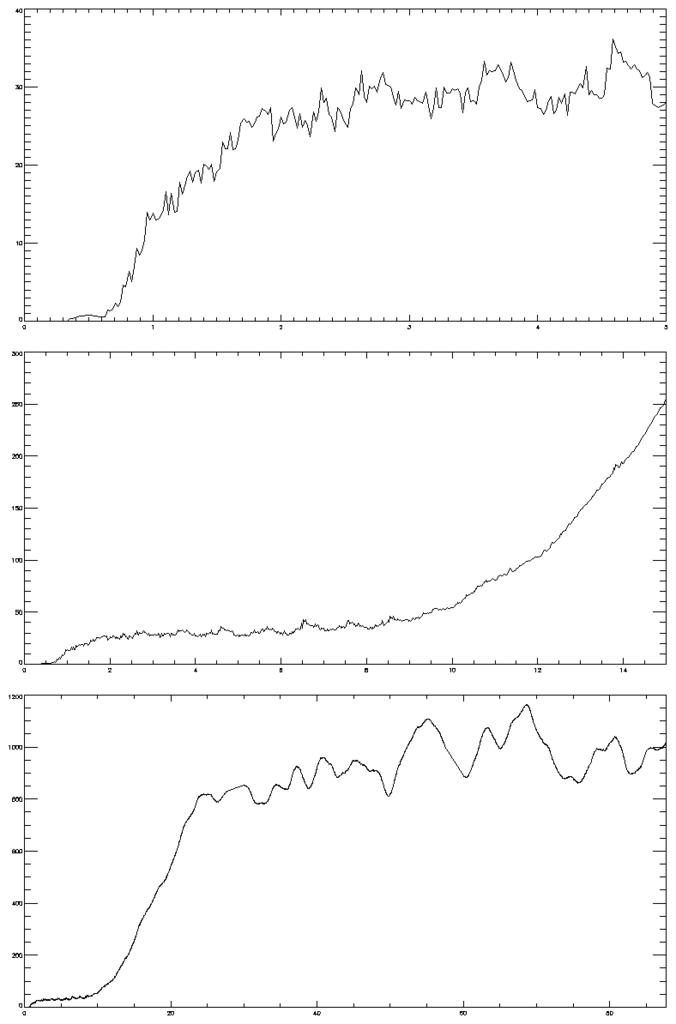
Going another level down, we come to the various arguments about the details of the Hockey Stick. Thats the level of the recent RC post Hockey sticks: Round 27, where we discuss two recent GRL papers. This is interesting stuff - if you're keen on statistics. If you're not, and you're baffled by the claims and counter claims, then you have two options: hop back up a level, because you've got to a too specialised for your understanding; or improve your understanding. Don't misunderstand me: there is a lot of interesting work to be done at this level. There are, as shown by the graph, a whole pile of records that agree on the main points but disagree in detail. Resolving this is an active and valuable area of research. If you're interested in policy, though, you've gone too far down. Go back.
Some people think that that the debate over the so-called "hockey stick" temperature reconstruction is a distraction from the development and promulgation of climate policy. And I agree (though I would replace "policy" with "science" cos I'm more interested in the science). And this is what we've been saying in the recent comments at RC. So if anyone were, hypothetically, to enquire why *others* should continue to care about it... Why is this fight important to the rest of us? the answer is: you shouldn't. It isn't. There: that was easy.
Oops: I forgot something and blew my dramatic ending. Sigh. There is (yet another) odd inversion about: the idea that if we were to switch from, say, MBH (less variance) to Moberg (more) that would somehow imply a reduction in expected future warming. That is completely wrong. If the past temperatures varied more, it implies a *higher* sensitivity to forcing, and therefore a *higher* future change.
[Updated to fix broken href; nothing new to see; move along now folks... :-)]


