 From Tamino, some nice graphs about the current situation in Australia. With all the wild excitement, it can be hard to see what's actually happening - after all, recall the Bazillion Rainforest fuss of not long ago.
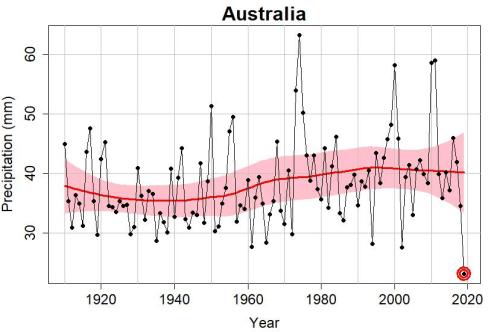
As to ppn, as Tamino puts it, Australia has had dry years before, and will again. Although 2019 was the driest on record, there’s no trend detectable in rainfall amounts, at least not yet; it looks like an unfortunate but random occurrence. This isn’t climate change, it’s bad luck. And that seems a fair assessment.
As to temperature, clearly that is a record high, and part of a trend; though also clearly above the trendline.
Now I draw your attention to the correlations; wet years tend to be cold, and dry years tend to be hot. I'm doing that by eye; Tamino didn't leave his data lying around and I can't be bothered to look for it; but look at e.g. 2000 (and then 2002), and 2010/11; or 1974. 1994 is less convincing. Anyway, as you'd expect, there's a correlation: a dry year has less moisture to cool the earth by evaporating, so tends to be hot2.
And that then suggests that this year's disastrous fire season is unlikely to be replicated in the near future; if it's caused by the exceptional dryness, then it's bad luck. Anyone wanna bet, that 2020's ppn will be back at or above the bottom pink band; and next year's Temp will be at or below the pink; and next year's fire season will be unexciting?
Recall that we discussed this somewhat in the comments at Climate emergency? in November. At least my thoughts there suggest that yearly averages might not be fine enough1.
Notes
1. And now Tamino with prompting has done another post on more regional stuff, but still doesn't find much in the way of trends.
2. Although this isn't obvious when you scatter-plot it; see RR.
Refs
* Hot enough to boil a monkey's bum!
* Australia’s Angry Summer: This Is What Climate Change Looks Like; by Nerilie Abram on December 31, 2019
* Australia, your country is burning – dangerous climate change is here with you now; by Michael Mann
* ‘Two hands are a lot’ — we’re hiring data scientists, project managers, policy experts, assorted weirdos… - Dominic Cummings
* Climate change now detectable from any single day of weather at global scale - Sebastian Sippel, Nicolai Meinshausen, Erich M. Fischer, Enikő Székely & Reto Knutti; Nature Climate Change volume 10, pages35–41(2020)
* Atlantic and Pacific oscillations lost in the noise; Absence of internal multidecadal and interdecadal oscillations in climate model simulations (arch); Michael E. Mann, Byron A. Steinman & Sonya K. Miller; Nature Communications volume 11, Article number: 49 (2020)
* A pre-hurricane climate change analysis gets major revision after the storm. Effort had predicted half of Hurricane Florence's rainfall was due to warming; Arstechnica (h/t VV).
* Australia Rain: Seasonal by State - Tamino
* Connections of climate change and variability to large and extreme forest fires in southeast Australia - Abram, N.J., Henley, B.J., Sen Gupta, A. et al. Connections of climate change and variability to large and extreme forest fires in southeast Australia. Commun Earth Environ 2, 8 (2021). https://doi.org/10.1038/s43247-020-00065-8.
42 comments:
Using average rainfall for the whole of Australia is not really descriptive of anything. I also mentioned this on Tamino's blog. Rainfall in southern Australia has declined markedly over the last 40 years.
Check out the bureau of meteorology special climate statement 72.
You need to look at the FFDI for the areas burning.
"Wild excitement?"
I was going to comment but then Nathan in #1 said what I was thinking. Australia is a huge place. I'd like to see data for each state and territory.
For example, Australia's area is 95% of the continental US's (lower 48 states).
Makes you wonder where they put it all.
All part of a longer trend
http://www.bom.gov.au/climate/updates/articles/a010-southern-rainfall-decline.shtml
Temp trends are also bigger in the south
Here in Perth we used to regularly get 1000mm of rain per year. Now we struggle to reach 800 most years.
we can't use our dams for water supply anymore.
Also don't know if you're interested but the large fires that wee burning in November when we last discussed australian bushfires (and I think we discussed the same pointsthen as well) are still burning.
Gospers Mountain megafire started around the 26th Oct - is still burning.
https://www.smh.com.au/national/nsw/the-monster-a-short-history-of-australia-s-biggest-forest-fire-20191218-p53l4y.html
People warned the Govt that this year was going to be a 'perfect storm' for fire - and the next few days, are going to be 'even worse' - yet again.
These fires won't stop until they get some serious rain - and that's not likely anytime soon.
Am I missing something? Av precipitation in Aust is about 400mm/yr not 40
Next year there won't be anything to burn...
William,
it is all about risk asessment -- how are the distributions changing. I refer you to a wee paper I wrote on fire risk in 2017 which got published in early 2018. https://www.ametsoc.net/eee/2016/ch12.pdf
Simon
> Using average rainfall for the whole of Australia is not really descriptive of anything
While I agree that regional stuff is likely to be interesting, I think it's unlikely that the continental stuff is uninteresting. And the further you need to go down into regional stuff, the less global you are, and the weaker the connection to GW.
> Check out the bureau of meteorology special climate statement 72
http://www.bom.gov.au/climate/current/statements/scs72.pdf I think. Well, fig 1 makes it look pretty pan-Oz. And the statement itself is quiet about connections to GW (it says "This trend is largest in..." in the summary, but doen't say trend over what, and doesn't return to the idea in the doc).
> http://www.bom.gov.au/climate/updates/articles/a010-southern-rainfall-decline.shtml
That's to 2015, so it would be good to see it extended to 2019.
> https://www.ametsoc.net/eee/2016/ch12.pdf
Hello again Simon! So "We find that changes in saturated humidity (likely dominated
by changes in temperature) and relative humidity (likely model sensitive) are the dominant drivers of VPD in both regions." Which doesn't sound implausible.
"I think it's unlikely that the continental stuff is uninteresting."
Ok maybe uninteresting is the wrong word. Perhaps something like not revealing for this situation?
according to CSIRO northern Australia should get wetter and the south drier, so the nation-wide average possibly may stay the same (or increase)
Although that report only goes to 2015, most of the southeast has stayed in drought conditions since. These maps may be helpful for you.
http://www.bom.gov.au/climate/change/#tabs=Tracker&tracker=trend-maps&tQ=map%3Drain%26area%3Daus%26season%3D0112%26period%3D1970
You can switch between seasons and time spans.
So in the south it's been a loss of around 40mm/decade since the 1970s.
Coupled with an increase of around 0.2+ degrees per decade.
This is not telling the whole story. As the risk from fire is also to do with wind speed and the humidity, as well as fuel load.
Also graph of southeastern wet season
http://www.bom.gov.au/climate/change/#tabs=Tracker&tracker=timeseries&tQ=graph%3Drain%26area%3Dseaus%26season%3D0411%26ave_yr%3D12
Incidentally, people keep saying "Temperatures in Australia have been high..." but I think this is irrelevant. Plus or minus 5 oC or whatever makes no difference to fires starting or continuing; it's all in the dryness (to which the temperature contributes, but).
> graph of southeastern wet season
That still doesn't look like a trend.
Been trying to find a copy of this paper, but it appears you have to buy the large book it is contained within (for $111.00)
https://cpsu-csiro.org.au/2019/11/20/the-scientist-who-predicted-the-bushfire-emergency-four-decades-ago/
"Plus or minus 5 oC or whatever makes no difference to fires starting or continuing; it's all in the dryness (to which the temperature contributes, but)."
I think you need to keep reading.
They use FFDI to measure fire risk, which is a combination of temperature, humidity, etc.
https://en.wikipedia.org/wiki/McArthur_Forest_Fire_Danger_Index
BOM released the SC72 that shows FFDI back to 1950
It's generally increasing everywhere.
http://www.climateinstitute.org.au/verve/_resources/fullreportbushfire.pdf
Report from CSIRO from 2007 giving projections on future FFDI trends (around p 27) So they have the 2020 FFDI around 1-10 % higher than the 1973-2006 average.
Certainly this year is generally > 10%
> It seems obvious, but actually we found the correlation was not temperature and fires, but relative humidity and fires
Indeed. And that seems supported by the abstract:
The daily McArthur Mark 5 Forest Fire Danger Index (FFDI) was calculated for the complete climatological data set for East Sale, Victoria, which covered the period 1945-1986. Neither temperature nor rainfall on their own are good predictors for annual summed FFDI. Relative humidity is the climatic parameter with the greatest influence on the FFDI on an annual basis. The effect of various climate scenarios on the annual summed daily FFDI at Canberra, East Sale and Hobart was examined. It increases if temperature or wind increases, or if relative humidity or rainfall decreases, but the climate scenarios of interest consist of a combination of these factors in which the temperature, rainfall and wind all increase in summer. There is a tendency for the temperature and wind effects to cancel the rainfall effect though the overall result appears to be an increase in FFDI.
Unfortunately, the default prediction for RH under GW is little change.
I'm not sure he can claim any great foresight, since "the climate scenarios of interest consist of a combination of these factors in which the temperature, rainfall and wind all increase in summer". Which is to say, if he predicted anything, it was more rain, not drought.
"Unfortunately, the default prediction for RH under GW is little change."
That is for the free atmosphere, which is important for the greenhouse effect. I am not sure whether this is also true for the near surface relative humidity, which would be relevant for forest fires.
I am not sure whether this is also true for the near surface relative humidity
Climate Explorer is always your friend. Near-surface relative humidity over South-Eastern Australia is indeed expected to decline in future. However, there are no clear trends to this point in time across the CMIP5 ensemble.
Regarding precipitation, CMIP5 models as a whole don't appear to necessarily expect that Southern Australian precipitation should have declined from 1920 to present, but they do in future. And they do expect declines for trends going from 1850 to present. I would guess this is because of increasing air pollution in Australia offsetting the effects of GHG warming on precipitation. Maybe also explains lack of expected RH change to date?
CMIP5 models as a whole don't appear to necessarily expect that Southern Australian precipitation should have declined from 1920 to present
Perhaps I should clarify that the CMIP5 mean Southern Australia precipitation trend from 1920-2019 goes up, rather than just not declining.
According to this page Australia's SO2 emissions have declined by 35% over 2014-2018. Maybe they need more coal burning?
This suggests increasing temps are important in calculating FFDI
https://www.google.com/url?sa=t&source=web&rct=j&url=https://www.cawcr.gov.au/technical-reports/CTR_010.pdf&ved=2ahUKEwj5pMHziujmAhWCxTgGHVx5CZUQFjAAegQICRAB&usg=AOvVaw1wJCf6EXqchLXtMc6fHcFx
http://www.bom.gov.au/climate/change/#tabs=Tracker&tracker=timeseries&tQ=graph%3Drain%26area%3Dseaus%26season%3D0112%26ave_yr%3D30
This looks down to me
Did you read the executive summary of this report from 2007?
http://www.climateinstitute.org.au/verve/_resources/fullreportbushfire.pdf
negative trend in rainfall since 1920 in fire affected areas
http://www.bom.gov.au/climate/change/#tabs=Tracker&tracker=trend-maps&tQ=map%3Drain%26area%3Daus%26season%3D0112%26period%3D1920
Nathan,
http://www.bom.gov.au/climate/change/#tabs=Tracker&tracker=trend-maps&tQ=map%3Drain%26area%3Daus%26season%3D0112%26period%3D1920
Weird, looks almost exactly like a population distribution map for Australia.
Sadly yes!
Unfortunately some of that decline may be due to land clearing...
And it's also where we need and want water.
"And the further you need to go down into regional stuff, the less global you are, and the weaker the connection to GW."
On a global basis, precipitation will increase with warming. Higher temperatures mean more evaporation which means more precipitation.
The distribution can not be static, both spatially and temporally. So a location might get something rather different, and the variation at a location might change as well. That difference might well matter, at least locally.
Like when the local forest burns along with your house.
Yes, the increase is mostly along the ITCZ.
Decrease in rainfall in southern Australia is likely due to the expansion and southward migration of the Hadley Cell.
"As to temperature, clearly that is a record high, and part of a trend; though also clearly above the trendline."
By my eye, looks like this will be an average year by 2035 or so. And clearly below the trendline by 2050.
@-WC
" And the further you need to go down into regional stuff, the less global you are, and the weaker the connection to GW."
That is not a logical conclusion.
Regional variation affect global effects to a small extent, but the global influence is complete on the regional stuff.
Bloody hell
Hard to find any 'green' bit (nature reserve) on this map along the southeast coast that isn't on fire...
https://myfirewatch.landgate.wa.gov.au/
Earlier work suggesting that RH will decrease in Southeast Australia with global warming, leading to much greater fire risk
http://www.cmar.csiro.au/e-print/internal/beer_x1995b.pdf
Thanks for the link. That's an old paper using a (by modern standards) primitive model; so the interest is in what-they-thought-then, not in the actual results. Having said that, fig 4 (https://www.flickr.com/photos/belette/49338820446/in/dateposted/) shows mixed results; CSIRO4 and 9 dramatically differ from each other, and 4 shows large areas of relative wetting (though the way they have drawn it, with only + or - indicated, means I think that areas with trivially small changes cna't be distingished).
But is it closer to reality?
The authors explain why they prefer CSIRO 9
I can't find a chart of RH in southeastern Australia anywhere online
But FFDI has been increasing...
https://journals.plos.org/plosone/article?id=10.1371/journal.pone.0222328
So that would suggest RH isn't increasing.
> But is it closer to reality?
Is what? 9 or 4? I tried to explain why I didn't think that is interesting. It might have been interesting once, but not any more. The models are just too old and too crude. Plus, those are 2xCO2, as people usually ran then: you want to see a big change, big enough to see over the noise. But we don't expect change to be linear; the sign of RH change over SE Oz could easily change between now and 2070.
9 or 4
But no matter.
I guess the question of is this fire season showing a climate change signal would be answered with a graph of RH trend?
Not just the mean matters.
https://www.nature.com/articles/s41598-017-17966-y
This sums up the situation pretty well...
https://twitter.com/rahmstorf/status/1214459704396713985
The areas that are burning are from around 30+S latitude
This is all drying out as the Hadley Cell expands and moves southward.
We've experience this as pretty significant drop in rainfall
mass tree death in the northern Jarrah forests of Western Australia and the drying out of wet schlerophyl forests in the east. These are normally hard to burn... But not now.
Well, SR is right that asserting no drying trend based on larger-scale avg isn't right, but if he put up data *showing* a drying trend I missed it.
It's certainly been drying since the 70s. Tamino's analysis says it's not yet significant for the whole of NSW, but it's definitely drier where the fires have occurred.
BOM has plenty of maps showing drying trend.
It's also been predicted by modelling. And it's only going to get worse... Bloody depressing....
Sorry William but the continental stuff is uninteresting* and the fires are connected. Put simply the "millenium drought" (https://en.wikipedia.org/wiki/2000s_Australian_drought) appears to have never ended. Note 3.5 about La nina breaking the drought. There was so much water introduced into Australian soil that global sea levels dropped but...
The areas of intense forest are not where much of that rain fell and the rain fell rather quickly. The ranges in particular saw mld recovery before descending into an even dryer period.
*including tropics, subtropics, two coasts, antarctic effects etc results in rainfall averages that have nothing to do with the fire grounds. they could well be the opposite of what you would expect if you extrapolated out.
One Australian scientist says to get rid of the gum trees. They're candlesticks. Replace them, I guess, with saguaro cactus.
Post a Comment