2005-07-06

Reading the Runes part II: Prometheus

Over at Promehteus, there is a forthright post on the latest Hockey Stick stuff. As usual, there is stuff in there whose tone I'd disagree with but there is some rather forthright language which I'd thoroughly agree with:

From the perspective of climate science or policy Rep. Barton’s inquiry is simply inane


is blunt. Or:

Of course, it is doubtful that Rep. Barton’s Committee (on Energy and Commerce, I remind you) actually has any real interest in the science of climate change, except as a tool of tactical advantage in the continuing political battle over global warming. Rep. Barton and others opposed to action on climate change will continue to gnaw at the hockey stick like a dog on a bone so long as they perceive that it confers some political benefits.


And:

The debate also consumes a lot of scarce attention on the climate issue – attention that would be better devoted to debates about policy options.


Quite right. And:

Of course, most Prometheus readers will know that the case for a human influence on climate is well established through multiple independent lines of research.


Tell me that I haven't been paying attention, but I haven't seen that unambiguously on Prometheus before. Lower down, I'd disagree with RP's tone, and he seems to have forgotten that Ammann and Wahl *have* replicated MBH. And It was clearly a mistake to use the MBH studies in the SPM is clearly wrong. Points 2 and 3 are badly wrong too, but hey you can't have everything.

Reading the Runes

mt points out over in sci.env that the NYT says (registration required)

Mr. Bush made a nod to the compromise effort at the news conference, saying, "I recognize that the surface of the earth is warmer and that an increase in greenhouse gases caused by humans is contributing to the problem."


Now this is close to Kremlinology, but although this is weak stuff (no numbers) Bush appears to be saying that the earth getting warmer is a problem; and that people are contributing to it. Many skeptics have gone over, from denying any human influence, to saying "of course there is an influence but its small". Bush is obviously avoiding, so far, the std.consensus that "most of the warming observed over the last 50 years is attributable to human activities" (IPCC) but saying that our emissions are contrib uting to a problem is, although weaselly, a fair step in the right direction.

Meanwhile, some more entrails, this time of the public sort. "Overwhelming Majority of Americans Favors US Joining With G8 Members to Limit Greenhouse Gas Emissions" says PIPA (tip: Chris Mooney). Also "The percentage saying that 'there is a consensus among the great majority of scientists that global warming exists and could do significant damage' has risen from 43% in June 2004 to 52% today. The percentage saying that 'scientists are divided on the existence of global warming and its impact' has dropped from 50% to 39%". Unfortunately, this mixes existence with impacts; I'm not really sure how I would answer such a question. I really must read up on the impacts literature sometime.

2005-07-04

Something happy for a change: Portland

From an article in the NYT:

Newly released data show that Portland, America's environmental laboratory, has achieved stunning reductions in carbon emissions. It has reduced emissions below the levels of 1990, the benchmark for the Kyoto accord, while booming economically.

What's more, officials in Portland insist that the campaign to cut carbon emissions has entailed no significant economic price, and on the contrary has brought the city huge benefits: less tax money spent on energy, more convenient transportation, a greener city, and expertise in energy efficiency that is helping local businesses win contracts worldwide...

2005-07-01

More Barton/Mann/Waxman

David Appell (here; and his prev) and Chris Mooney have more on the "Barton affair". Waxman says:

These letters do not appear to be a serious attempt to understand the science of global warming. Some might interpret them as a transparent effort to bully and harass climate change experts who have reached conclusions with which you disagree
.

Indeed. So its good to see a heavyweight politician coming in on the side of science. Of course, this could just be a democrat-republican fight. The original Barton letters were politics/$ not science, so its probably right for this to turn, nakedly, into a political fight.

Interestingly, though, no-one seems to have anticipated this (even the normally politically astute Prometheus), even though it is (in retrospect) obvious.

BTW: JF: can you get CM back on PF please?

More satellite stuff, including explanations, a bit

When I wrote my prev post (BTW, the same caveats about data handling that I made there still apply), I was in a bit of a hurry and included little in the way of background. So... there is some good stuff at http://en.wikipedia.org/wiki/Satellite_temperature_measurements (well I wrote most of it). That page also includes links to various groups, but RSS is Remote Sensing Systems and S+C/UAH is here and other places; but their pages are in a bit of flux because they haven't caught up with their latest correction yet! The RSS pages have some nice descriptions of how the stuff all works.

Anyway, I've done a few more pics: here are maps of the trends (1979-2004, from annual mean data) from S+C vn5.2, 5.1, RSS and 5.2-5.1:


The last is quite startling, to me: it looks like an essentially zonally symmetric correction in the tropics. Odd.

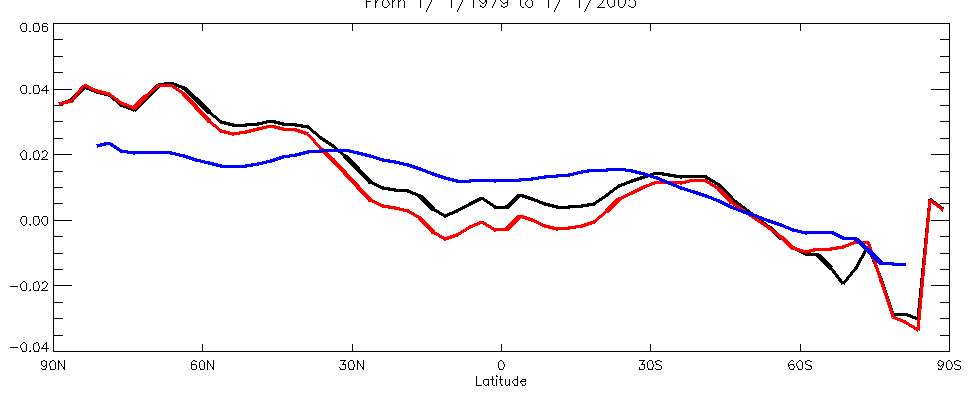
And then the zonal means of the trends:


Also interesting (perhaps) is the trends to-year for the two series:


year 5.2 5.1
1992 0.0009 -0.0005
1993 -0.0025 -0.0046
1994 -0.0017 -0.0045
1995 0.0015 -0.0014
1996 0.0021 -0.0008
1997 0.0028 -0.0001
1998 0.0099 0.0070
1999 0.0089 0.0058
2000 0.0080 0.0046
2001 0.0090 0.0054
2002 0.0108 0.0072
2003 0.0117 0.0080


These are the trends calc from the monthly data, from jan 1979 to dec of (year). They aren't quite the same as the ones on the wiki page (for 5.1) but thats probably down to minor processing (my area avg vs theirs, perhaps). So on my version of their v5.2, the negative trends stop in 1994, 3 years earlier than for 5.1.

Meanwhile... over at Deltoid, Scott Church commented: Note that these are TLT trends, so they won’t compare directly with current versions of RSS MSU trends which are for the middle troposphere (the corresponding UAH trends for an RSS or Prabhakara comparison will be TMT). I'm actually a teensy bit confused about the various products and levels. The S+C vn5.1/5.2's are definitely comparable. The RSS data may not quite be. The RSS stuff is their TMT product, which is a merge of MSU channel 2 and some AMSU data.

2005-06-30

First look at S+C's MSU vn5.2?

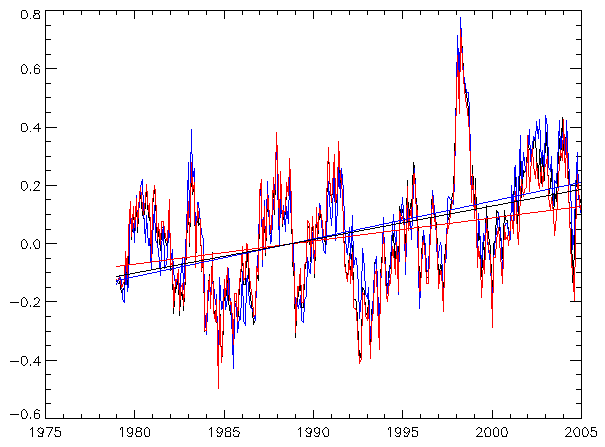
I don't think S+C have officially released their new "corrected" MSU LT data, but there are files on their ftp site called _5.2 with a date of 30th June. So I'm assuming thats it. I need to write this post in a hurry cos James A challenged me to a blogging race to be first to the data. I've had to read them in, calc the global means, and then the trends myself. So this is an ever-so-slightly dodgy process. But, I'm using the same code as I used for vn5.1, which appeared to work, so likely this does too. It gets about the right answer (trend 0.116 oC/decade over 1979/01 to 2004/12) so thats nice too.

Here are some pics:


The black is the 5.2 series; the red is the 5.1; the blue is RSS. Trend lines are drawn on.

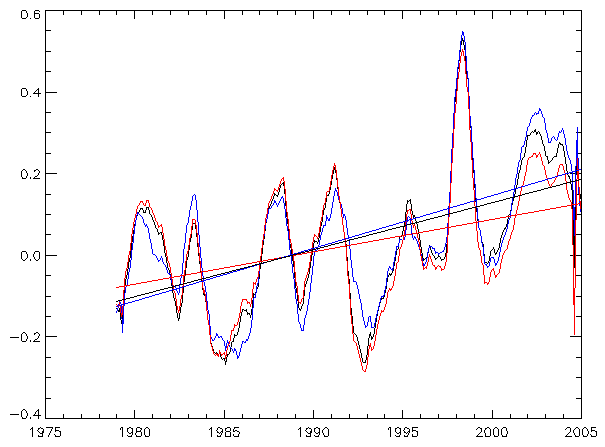
That pic is a bit hard to read: you might find:


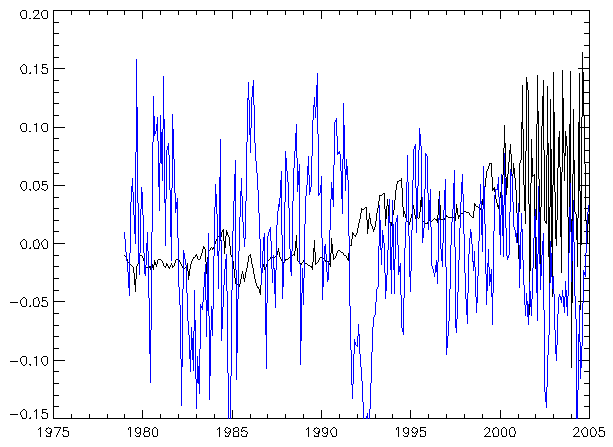
a bit easier. That is an 11-month running mean to remove some of the wiggles (except at the end points...). Some interesting features appear in that, which are clearer in a difference plot:


Black is now S+C 5.2-5.1; blue is 5.2-RSS (and the RSS is vn2.1, I think).

So... there is a jump between 5.2/5.1 around 1992/3 (who knows when the satellites changed?); and it goes all wiggly after 2001. Interesting.

Well, there you are. Don't get too excited because I by no means guarantee that this is (a) correct or (b) that the 5.2 files are indeed the correction that S+C promised. Time will tell.

Gobbledegook from Yury Izrael

Some while ago, Prometheus (always first with the news...) complained about IPCC authors misusing their titles. Yury Izrael (or, as he styles himself, "Yury Izrael, Director, Global Climate and Ecology Institute, Russian Academy of Sciences and IPCC Vice President") is now hard at it, at RIA Novosti ("Present-day global warming resembles the 1940s"... well, no it doesn't its warmer now; the garbled ice-age bit; etc).

In this case, its perfectly clear that the IPCC don't agree with him, and given the recent academies statement (signed by the RAS) its clear he's not speaking for the RAS either.

Its puzzling that he is an IPCC vice-chair, given his apparent lack of any scientific interest in the issue. He appears (page 2) to be one of 3 vice-chairs of the IPCC bureau (none of whom I've heard of... this may not be their fault, it may be our interests don't overlap; or it may well be because the vice-chairship is a political sop to be given to placate certain interests). But then again, I'm not clear what the IPCC Bureau actually does... it doesn't look like he is connected to the IPCC WG's.

OTOH, although he is doing his best to make skeptic-like statements, he's still with the IPCC consensus:

Global temperatures will likely rise by 1.4-5.8 degrees during the next 100 years. The average increase will be three degrees. I do not think that this threatens mankind. Sea levels, due to rise by 47 cm in the 21st century, will not threaten port cities.


So for T change and SRL, he's straight down the IPCC line - no room for James's bets, sadly. This seems to becoming the way: skeptics are now accepting the IPCC views (YI isn't even trying to argue for the low end of the range) but embedding it in dodgy language. Progress, perhaps. Incidentally, whilst I wouldn't agree with "I do not think that this threatens mankind" (too definitively dismissive) I have some sympathy for that view, as I've written elsewhere. If skeptics like YI could just rephrase their language a bit, things could be so much better. All he is really saying is "We accept the WGI consensus but don't agree on the future damage". But perhaps thats too boring an opinion to print.

2005-06-28

Joe Barton (R-Exxon) vs hockey stick

I've stolen my headline from Tim Lambert, I'm sure he'll appreciate the imitiation. But Chris Mooney broke the story. So the naughty (and rather desperate) republicans are down to witchunting (cue Monty Python... except, one presumes, for the denouement). TL has a nice round-up of reaction from the blogosphere, all outraged by this attack (as am I). One notable exception to this sanity is Prometheus (but not RP), where KV manages to forget that the original MBH is 98, in order to push some cheap rhetorical tricks.

To inject a tiny bit of science into this... if you look at the nice piccy that Dragons flight created to display the variety of 1000 (and 2000) year temperature reconstructions, you discover that *all* of them fit the words of the IPCC TAR SPM:

New analyses of proxy data for the Northern Hemisphere indicate that the increase in temperature in the 20th century is likely to have been the largest of any century during the past 1,000 years. It is also likely that, in the Northern Hemisphere, the 1990s was the warmest decade and 1998 the warmest year [1].


This is all still true (the fact that 1998 is still warmest is just chance, of course) with any of the other records. Which shows you that the TAR was quite cautious in its use of the MBH record (which was entirely appropriate, it being fairly new then). So attacking Mann (or, being more charitable, attacking MBH98) is pointless, from a scientific standpoint. But then, this isn't about science, its about $.

Now that I have a chance to reflect, perhaps the Black Knight scene is more approriate...

S+C/UAH MSU temperature trend now 0.12 oC/decade

If you look at http://climate.uah.edu/may2005.htm you'll find that the S+C MSU temperature trend for the troposphere is now 0.12 oC/decade. Last month it was only about 0.08 oC. Presumably, some recalculation has gone on, but I don't know what. I couldn't see anything obvious on their site.

For those asleep, the S+C record has for some time been notably lower than the others (see http://en.wikipedia.org/wiki/Satellite_temperature_measurements) but now is quite similar to the Mears et al value. See-also my last post, which was just a coincidence...

Isn't this interesting?

2005-06-27

I'm number 4!

At the start of this month, I was able to proudly announce that I was the #7 google hit (or #6, for google.co.uk) for the word "stoat". Now I've shot up the rankings to #4 (or #3)!

For reference, my so-called competitors are:

  • http://www.stoatmusic.com/ - Indie pop/rock band based in Dublin
  • http://www.yptenc.org.uk/docs/factsheets/animal_facts/stoat.html - facts about real stoats
  • http://www.bbc.co.uk/nature/wildfacts/factfiles/201.shtml - ditto, from the BBC

    Now I've linked to them and helped perpetuate their dominance :-(

    Amusingly, when I do the google search the side-bar ads come up with:


    Stoat
    Great deals on Stoat
    Browse a huge selection now!
    www.eBay.com


    Are people really looking for great deals on stoat? There turn out to be quite a few stoat-related items on sale. Perhaps you're interested in TAXIDERMY..STOAT IN GLASS CASE..LOVELY ITEM. Or perhaps not.

    Ahem. Thats enough stoat-related nonsense for today. Later... the return of the science. I promisxe.
  • Causes of differing temperature trends in radiosonde upper air data sets

    As an experiment, here are two abstracts I came across whilst browsing journals. Both are about the puzzle of upper air temperature trends. The puzzle (for those who have been asleep) is that the surface is warming, the models say the upper air should warm more, and some of the upper air series say it is but others say its not. If you're a rabid septic you take the lowest estimate of upper trends and say the sfc must be wrong; if you're a wild-eyed alarmist you take the sfc and the highest upper air estimate as gospel; if you're a scientist you admit there is a puzzle and await its resolution or write papers like those below. For my own opinion, I think that the sfc obs are probably more reliable than the upper air.

    These abstracts don't resolve the puzzle. I confess, I haven't read the papers, just the abs, but it looks to me like they simply confirm the continued existence of the puzzle. What would resolve it? One of the MSU groups finding a major error in their methods or code, perhaps. The realisation that sfc and upper air don't have to follow each other on decadal timescales - this would reconcile sfc and lowest upper air estimates, but would leave the various MSU records still conflicting. Something else? We shall see.

    Causes of differing temperature trends in radiosonde upper air data sets; Free M, Seidel DJ, JGR-A, 110 (D7): art. no. D07101 APR 6 2005

    Differences between trends in different radiosonde temperature products resulting from the varying choices made by the developers of the data sets create obstacles for use of those products in climate change detection and attribution. To clarify the causes of these differences, one must examine results using a common subset of locations to minimize spatial sampling effects. When this is done for the Lanzante-Klein-Seidel (LKS) and Hadley Center (HadRT) radiosonde data sets, differences are reduced by at least one third. Differing homogeneity adjustment methods and differences in the source data are both important factors contributing to the remaining discrepancies. In contrast, subsampling the microwave sounding unit (MSU) satellite data sets according to the radiosonde coverage does not generally bring the trends in the satellite data closer to those in the radiosonde data so that adjustments and other processing differences appear to be the predominant sources of satellite-radiosonde discrepancies. Experiments in which we subsample globally complete data sets provide additional insight into the role of sampling errors. In the troposphere, spatial sampling errors are frequently comparable to the trends for 1979 1997, while in the stratosphere the errors are generally small relative to the trends. Sampling effects estimated from National Centers for Environmental Prediction reanalysis and MSU satellite data for seven actual radiosonde networks show little consistent relation between sampling error and network size. These results may have significant implications for the design of future climate monitoring networks. However, estimates of sampling effects using the reanalysis and the satellite data sets differ noticeably from each other and from effects estimated from actual radiosonde data, suggesting that these globally complete data sets may not fully reproduce actual sampling effects.


    And another one, with a star cast of authors from the Tropospheric world, including Christy and Wentz, Angell and Parker; Free as above...

    Uncertainty in signals of large-scale climate variations in radiosonde and satellite upper-air temperature datasets ; Seidel DJ, Angell JK, Christy J, Free M, Klein SA, Lanzante JR, Mears C, Parker D, Schabel M, Spencer R, Sterin A, Thorne P, Wentz F, J. Climate, 17 (11): 2225-2240 JUN 2004

    There is no single reference dataset of long-term global upper-air temperature observations, although several groups have developed datasets from radiosonde and satellite observations for climate-monitoring purposes. The existence of multiple data products allows for exploration of the uncertainty in signals of climate variations and change. This paper examines eight upper-air temperature datasets and quantifies the magnitude and uncertainty of various climate signals, including stratospheric quasi-biennial oscillation (QBO) and tropospheric ENSO signals, stratospheric warming following three major volcanic eruptions, the abrupt tropospheric warming of 1976-77, and multidecadal temperature trends. Uncertainty estimates are based both on the spread of signal estimates from the different observational datasets and on the inherent statistical uncertainties of the signal in any individual dataset.

    The large spread among trend estimates suggests that using multiple datasets to characterize large-scale upper-air temperature trends gives a more complete characterization of their uncertainty than reliance on a single dataset. For other climate signals, there is value in using more than one dataset, because signal strengths vary. However, the purely statistical uncertainty of the signal in individual datasets is large enough to effectively encompass the spread among datasets. This result supports the notion of an 11th climate-monitoring principle, augmenting the 10 principles that have now been generally accepted ( although not generally implemented) by the climate community. This 11th principle calls for monitoring key climate variables with multiple, independent observing systems for measuring the variable, and multiple, independent groups analyzing the data.

    2005-06-25

    Honey and Hayfever/Asthma

    Quite a few of the people who buy honey from me do it because of the theory that eating local honey is a remedy for hayfever/asthma. The idea is that the pollen in local honey in some way immunises you, or perhaps that it makes the body less likely to react to it. Its a plausible thoery, and may even be true, though I never actually use it to advertise because it probably amounts to making unsustainable medical claims.

    2005-06-23

    Galileo: Dialogue concerning the two chief world systems: magnetism

    I've been reading the "Dialogue concnerning the two chief world systems" by Galileo (see-also: wiki). I've got to the end of day 3 (of 4). Day 4 is apparently about G's (incorrect) theory of the tides, which may well be an interesting thing in itself. Apparently, he was so keen to prove that the earth moved, that he rejected the idea of "influences" from other bodies (the moon) in favour of a theory that (he thought) demonstrated directly what he wanted to prove.

    There is a motto in that, of course... but I'll talk about a bit that I have actually read: magnetism. Which comes at the end of the third day. I wanted to point you to an online source, but sadly it the "full" texts I found all omit that bit as peripheral to the Copernican/Ptolemaic dialogue which is the main purpose.

    Anyway... they are talking about Gilberts theory, which was that the Earth is a giant lodestone. Which of course we now know to be wrong. Although arguably its close enough. Anyway, the point is, that G points out various things about lodestones, ostensibly from observation. Some of these are true: that the attraction is greater at each end and falls to zero in the middle. That it points N-S (incidentally, I see no evidence that he realised it didn't point to true north). He also notes the fairly new observation of the dip of the lodestone - ie, that if free to pivot vertically, it doesn't stay horizontal but dips, according to latitude. But here he gets a bit weird. He asserts that the southern pole of the magnet is stronger. He asserts this, because he explains the dip by the greater strength of the S pole (isn't this wrong? doesn't a magnet dip with N pole downwards in the NH?). Then a bit later on he says of course, this strength changes, with no difference at the equator and at the pole a magnet stands vertical (this latter "fact" was of course unobserved, despite being presented as an observation). Now it seems pretty weird to write it this way (in terms of changes in strength of the magnet) when an explanation in terms of following-lines-of-force is fairly easy (but did he know about that? He talks of lodestones attracting iron filings, but *doesn't mention putting a lodestone under a sheet of paper and sprinkling filings on top to visualise the lines. Also, (of course?) had he actualy measured the load-bearing strength of each end he would have found it the same.

    So... the motto I was going to draw from this was that small flaws in peripheral areas don't invalidate your main argument :-)

    2005-06-19

    Comment on sci.env!

    I've just noticed that James Annan has this:
    Comments are welcome, but I don't expect (or wish) substantial debate here. Please go to news://sci.environment where all can contribute. (You'll probably want a proper newsreader with a killfile though)
    I think James is substantially right about this, for any number of reasons, most of them obvious. I'm talking about the science posts, of course. The interspersed beekeeping and stuff is fine here. And of course, if you *want* to comment here, thats fine as well. But commenting on sci.env has a number of advantages:

    * No one owns it. I can't censor your comments, and so you don't get to post absurd comments complaining about censorship.
    * Lots more people will see your comments, most likely.
    * It just works better as a forum for dialogue. Blogs just aren't very good at that.

    I read sci.env (so does JA) so I'll see any comments there as soon as I see them here. I suppose, to be fair, I ought to point out the disadvantage of sci.env, which is the high bozo coefficient, but nothing is perfect (apart from the weather on this fine evening, which has cooled down from absurdly hot during the day to very pleasant an hour after sunset, with a new full moon low to the south).

    Any comments? :-)

    2005-06-17

    Betting on climate change... or not?

    Betting on climate change is the new meme. Everyone is doing it... or rather, everyone is posting about it. But the septics are shy. The "king" of the bets is James Annan: he has a nice summary of the bets here and a pile of links to others on the subject which I won't replicate. James is (as far as I know) the only person to have actually presented work at a scientific conference on the issue (poster pdf here). He has a long series of skeptics who have failed to back up their words with money, or who have shuffled their words when challenged. James wrote up a post for RC (here) which I think holds the record for the most comments, certainly in the shortest time. Roger Pielke has a post too (in fact he just beat us to posting, but ours was under review...). And there is a Reason mag article (which contains an amusing disclaimer wrt me, but its trivia, as you'll know if you saw the original) (which has now vanished; Reason are shit at keeping their old posts visible; here's an Internet Archive of it; or, if you prefer, the first version with the error about me and Lindzen, and  - unforgiveably - mis-spelling my name). The Reason piece is worth reading, if only for the frisson between the reporter, who clearly feels rather let down by Lindzen and is obliged to say that he somehow misheard or misunderstood Lindzen (over the 50/50 warming/cooling, which is unsupportable). It has been a very interesting process (and probably not finished yet). Who would have thought that Michaels estimates for future change are actually within the IPCC limits? That sets an interesting challenge: how to refine the bets to pick him up more precisely? There is a tension as to the most desireable length for a bet. Obviously, going one or a few years ahead only is silly: natural variability means you can't predict individual years. Going too far ahead isn't good either: by 2100 most people reading this will be dead (unless my words last rather long than I expect them to); and predictions out to 2100 are more dependent on future CO2 emissions (ie, economics) rather than climate sensitivity (ie, climate science). James has focussed on predictions to 2030 and this seems sensible: its quite a long way out, but we'll still be alive (JA refers to it as funding his retirement, but I'm a bit older...) we hope. Further, predictions to 2030 are rather less sensitive to future CO2 emissions (being more conditioned by current levels and committed warming). OTOH 2030 still leaves the possibility of the "wrong" answer due to natural variability, but you have to live with a small risk of this. So, hopefully people will take up on James bets. If enough money pours into him that he runs out of ante, I'll be happy to fund his part of his bets. Perhaps we could even get a syndicate together. But at the moment, he lacks someone to bet against.

    "We don't even know how many legs he's got"

    FB_IMG_1729841509917 This one is a brief foray into politics: the War in Iraq:

    There is an article in the current Economist, which is rather downbeat on the Great War, although they have been pro-war boosters all along. It contains the wonderful:

    "Who would die so wantonly? It beats American intelligence officers. Asked about Abu Musab al-Zarqawi, a notorious - and, according to some reports, one-legged - Jordanian fanatic, a senior American official admitted, "We don't even know how many legs he's got."

    You have to laugh, or you'd cry. If you want reasons for the latter, visit the "Lancet study" section of the new-look Tim Lambert, which not only tells you how many excess Iraqi deaths we've caused, but also shows to what lengths people will go to avoid knowing it.

    2005-06-15

    Antarctica and sea level rise

    There's a convoluted post over at World Climate Report. Its about the recent Science paper (Davis, C.H., et al., 2005. Snowfall-driven growth in East Antarctic ice sheet mitigates recent sea-level rise. SciencExpress, May 19, 2005.). This paper tells us that East Antarctica elevation is increasing, probably because its gaining mass. Thats exactly what global warming tells us should happen, and of course its factored into the IPCC predictions of sea level rise (chapter 11). The WCR post content is so badly distorted by its presentation that I thought I'd try to interpret it here.

    So: E Ant is getting bigger; fair enough. What WCR don't point out is that this is only a small fraction of the SLR from other sources, mainly thermal expansion. As far as can be told, its just about balanced by Greenland melting (at the moment, and very roughly into the future too).

    They also attempt some kind of counterpoint against the warming/melting on the Antarctic peninsula and/or West Antarctica. Weeelllll... the main point about the Peninsula stuff is that it is a sudden dramatic warming with consequences (locally). The impact on SLR is small though. The point about West Antarctica is that there is potentially a lot of SLR in there. Current best-guess is that its going to stay potential, with an unknown chance (10%? 5%? take your own guess) of a nasty surprise of 1-2 m of SLR from some kind of surge over... 1 century? 2? Take your own guess again.

    2005-06-13

    Fluid dynamics: honey spirals

    When straining my honey, I observed that the long thin stream of honey falling into the pan doesn't just fall straight down, or flop randomly, no, it arranges itself into tidy spirals. See pix:


    Isn't that pretty? It looks like glass. Its not a steady state: the tower builds up, then the weight gets too much for it, and it semi-collapses down, then builds again. The tower is about 1 inch high (metric? pah!), the fall of the whole stream from the strainer about 1-2 feet, and the build-shrink cycle about 1-3 seconds, though it changes as the honey stream slowly thins out. Its not caused by motion at the top of the stream, which is steady, as is the whole stream until just above where it curves off.

    2005-06-12

    Speculation: the need for science?

    I knew there was something else I meant to say about the naughty Bush people, and this is it...

    How much does it matter if the US "elite" believe in science or not? Will it work if they only believe in some bits? (I'm using "elite" in quotes to mean whatever-I-want-it-to-mean, of course).

    It looks to me that a lot of people are complaining about the Bush executive's attitude to science, which appears to be to censor and/or obstruct anything they dislike or find inconvenient. I'm thinking about climate change, cos thats the bit I'm familiar with (although its not a great example, as any harm doesn't fall particularly on one country), but there are other isses (stem cells (I don't even know what they are...), Creationism, etc etc).

    On these issues, science is telling Bush (OK, I'm going to say "Bush" from now on...; map him to a broader group in your mind) things he doesn't want to know. So he pushes away that bit of science. The problem is that doing this with an increasing array of different bits of science will leave him (if he is successful in hanging on) with the idea that this works.

    Now I (and many other people) would argue that much of the material prosperity of modern industrial society is built on science/engineering, which simply doesn't work if you push away inconvenient facts. If your widget factory is making deformed widgets, its no good holding a commission of inquiry, then appointing some uncredentialled person to scrawl all over its findinsg, and conclude that the uncertainties are such that its possible some of the widgets are OK. They'll just stop working and if you do this enough your society will grind to a halt.

    But... is it possible to envisage a situation where the wacko "elite" all believe in God, Creationism, no Global Warming, etc etc, and yet underneath there is a layer of technology that keeps working, keeps creating, and keeps your society ahead? Perhaps, if they let the underlayer alone, but they wouldn't. The creationists would interfere with the schools and universities. Can you really do genetics if you believe in creationism? (this is possibly a testable question: *are* there any genetics researchers out there (of any quality) who are known creationists?).

    Well, I don't know, just thinking aloud. My other Great Theory about the collapse of the US is that it will decay under the weight of lawyers.

    2005-06-11

    Cooney goes

    The Bush folk have been naughty again, once again watering their science with politics, as the NYT discovered; Quark Soup has links to scans of the memos themselves.

    According to the R4 10 o'clock news, Cooney has resigned/been sacked or something (and the NYT agrees). The Whitehouse apparently insists that this is nothing at all to do with the memos, but its unlikely that they expect anyone to believe that [1].

    2005-06-10

    Cactus flowers and swarms

    [Note: this is the old blog. The latest cactus-related stuff on the new blog is http://scienceblogs.com/stoat/2010/05/cactus.php -W]

    Every now and again the cactus that lives in a sunny spot at the top of our stairwell (just next to the sadly unwashed window...) flowers. The flowerings are rare - less than once a year - and suddenly I notice that the scruffy old dusty plant is briefly beautiful. perhaps I should sent it back to its native desert to live with JF...


    The plant has a history: it was given to my grandad by my uncle; both are now dead, so the cactus is in memory of both of them.

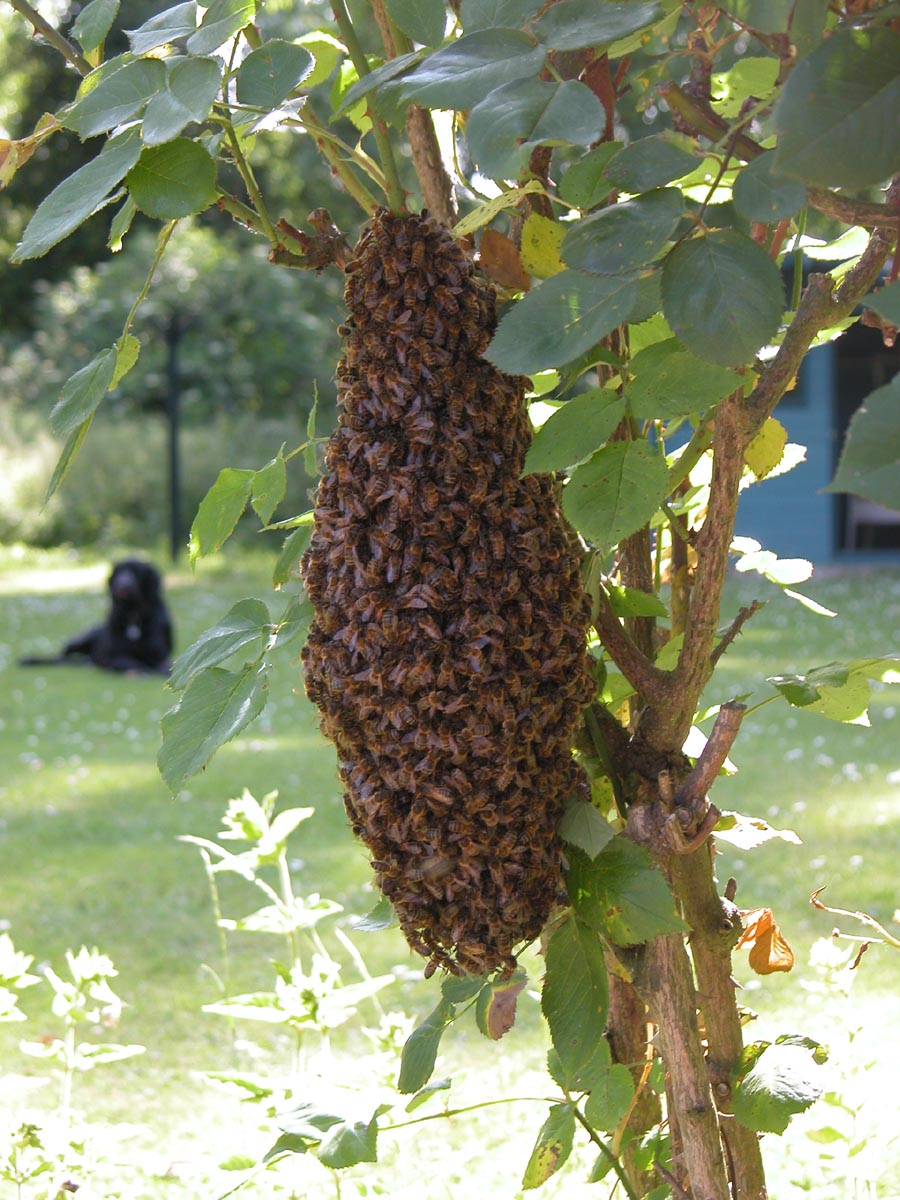
    Meanwhile, I got called out to a late swarm of bees, at the local Big House (well, the ex-rectory). Here they are:


    A bit scrawny for a swarm. The dog in the background didn't quite know what was going on. Anyway, into a box they went and I found someone who wanted them. We have a surfeit of green plastic kitchen waste bins around, which make nice bee-proof containers, so (after sellotaping it shut) I was able to walk into their house, swinging the bucket around (carefully...) saying "anyone want a box o' bees?" and the children put their ears to it to hear the bees buzzing.

    The next day the people at the house gave me some of their eggs, and a bottle of wine, in exchange for clearing the bees for them. No one has ever done that before! Normally, its not quite clear whether I'm doing them a favour or not: they are grateful for the bees removal, but they kind of suspect that they are my bees in the first place. Which, sometimes, they are.

    Serendipitous Epiphenomena

    A plug for a friends blog... MC has the good sense to choose uncommon words for his blog name, so gets to be google #1 for the two-word combo, and perhaps surprisingly #2 for "epiphenomena". See New technology will save the environment... for a rather fun cartoon. And elsewhere there for some other cartoons, and even some interesting words... I liked the Trix bit.

    2005-06-09

    Climate is stable in the absence of external perturbation

    I think that the climate (specifically the Holocene climate, ie since the end of the last ice age) is stable: ie, there are no chaotic swings or wild jumps. You can't say the same for the last glacial period, because there *are* large swings called Dansgaard-Oeschger events and perhaps more. Those jumps are (probably) linked to the Laurentide ice sheet, so its just possible to finangle it by making the ice sheet an external forcing, but that could be considered cheating. Anyway, I'm talking about now, not then.

    Of course, this isn't a very novel view: if the climate wasn't stable and responding fairly smoothly to imposed perturbations, then you couldn't attempt to predict it. So the-climate-is-stable is the view, probably without ever having considered it terribly carefully, of most climate scientists.

    But, of course, you get skeptics saying: if you can't predict the weather a week in advance... (all together now)... How can we predict the climate 100 years in advance?. There are lots of answers to this: the most obvious are in the previous post: another one is: weather and climate are different. Thats why they have different names.

    So: what is climate? A question not often bothered with. The answer is, something like, the statistics of weather. So this includes the 30-year running mean that is the older "definition" of climate; as well as the year-to-year variability. For example, if you look at the temperature record then you see that the interannual variability has remained about constant over the past 120 years of the instrumental record. The same page shows that the average (global/hemispheric) temperature has (excluding the most recent GHG forced episode) stayed within +/- 0.5 oC of a mean value over the past 2000 years. Thats really quite stable.

    So what transforms a chaotic system (weather) into a stable system (climate)? Averaging, of course. Predicting the temperature on any given day of next summer is impossible: predicting an average summer temperature is easier; predicting a 10-year mean is easier still. There will probably be, next summer in the UK, one day that is colder than the warmest day of next winter (which is itself a stable climate statistic, of course its one that I've made up off the top of my head but its quite likely true...). However, next summer will certainly be warmer than next winter. Note that the famous "year without a summer" wasn't a chaotic fluctuation: it was a response to an external perturbation, viz the volcano Tambora.

    Its possible to produce a simple model of this, the Lorenz equations/attractor: the famous butterfly shape. For the rest of this para I'm relying purely on memory, so please correct me, but: the Lorenz equations lead to chaotic trajectories, ie initially close trajectories diverge. But: the overall PDF (probability density function) of particle-location is perfectly stable (and bimodal) if you average. You can modify the equations to include a forcing term: this results in shifting the PDF so the particle sits in one of the wings more often than the other, but is nonetheless a smooth response to the forcing. This is all Tim Palmers stuff, and he wrote it up nicely in weather some time (his point was, that climate change could be more about different residence times in various modes than shifts in the modes themselves). If anyone (JA?) can point me to a decent set of refs for this bit, I'd be grateful...

    What about large scale shifts like the ice age cycle? These appear to be regular, and linked to orbital forcing, so count as responses to external forcing (albeit with internal feedbacks amplifying it). Even some of the variability of the last 2kyr comes into the forced category, though its not clear yet quite how much: bits of the so-called MWP/LIA may be.

    Of course people *do* worry about is the possibility of chaotic shifts: the shutdown of the THC could come into this class. Methane clathrates could, too. But at the moment, AOGCMs don't produce chaotic THC shifts that simpler models do. This could be a flaw in the GCMs. Or they may be right.

    Yet more stoats

    If #7 wasn't enough, you can be even more stoaty here (thanks JA, even if he prefers waffle).

    We'll return to the science shortly, with the return of that old favourite, "is the climate system stable (in the absence of external perturbation)?". I shall be arguing "yes" (i.e., it isn't chaotic). If you disagree, comment your objections quickly and I'll rip their throats out (sorry, back to the stoats).

    David Bellamy sacked by CAT

    James Annan's Empty Blog becomes steadily less empty, mostly with the interesting betting-on-climate stuff, and also picks up on something I'd totally missed, viz that David Bellamy has been sacked by CAT for talking nonsense about GW (actually it probably wasn't that particular thing, but the more recent rubbish about glaciers where he got shredded by Monbiot). CAT say: "...Some of Prof Bellamy’s recent published statements seem to be flying in the face of the considered opinion of the majority of the scientific community...". Well yes indeed. Will the wildlife trusts follow? Or (better, but less likely) will Bellamy actually start talking sense?

    2005-06-08

    I'm #7!

    I'm the number 7 (of 89,500) google hit for "stoat" (this is a bit disappointing: yesterday I was #6...).

    DA is #6 for Quark, and TL is #1 for Deltoid, though.

    2005-06-07

    Michael Howard says: The Tories and the US have done better than Blair on climate change

    A while ago I commented on the UK govt record on climate change (by which I meant the current labour govt), and concluded the rhetoric has been good but the action disappointing.

    Now Michael Howard (Tory lame-duck leader of the opposition) has written an article for the Grauniad And what if the sceptics are wrong? The Tories and the US have done better than Blair on climate change , which starts: Climate change is one of mankind's greatest challenges. In the past 30 years world temperatures have increased by almost 0.5C. We cannot predict with certainty what will happen now, but the risk of abrupt climate change certainly exists. Human activity is increasing the concentration of carbon dioxide and other greenhouse gases to levels unprecedented in human history. If we do nothing, or next to nothing, those levels will continue to rise, progressively increasing the risk of runaway global warming. I'm a bit dubious about the abrupt/runaway stuff, but again: its good rhetoric.

    Howard gets a bit carried away praising local US initiatives, but this is mostly because he doesn't want to criticise the US and wants to say The American people have shown that not being a signatory [to Kyoto] need not stop one from making progress on climate change. Sadly, Tony Blair has proven the corollary: being a signatory does not guarantee progress.

    MH (correctly) points out that the UKs major CO2 cuts came from the dash-for-gas (replacement of a lot of coal powered plants by gas) under the Tories. But... he is wrong to imply that this was done for the purpose. AFAIK it was done because the Tories didn't like the power of the coal miners and were keen to see it reduced.

    There is more good rhetoric in the article, and I suppose its good to see all the major political parties in the UK committed, in theory, to reducing CO2. But... despite all the cheerful political knockabout, there isn't much in the way of concrete plans for reducing our emissions in the article. So I fear that my verdict on him is no better than on Blair.

    2005-06-05

    Should I kiss the vipers fang / Or herald loud the death of man?

    A miscellaneous posting with no science whatsoever.

    I've been on hols


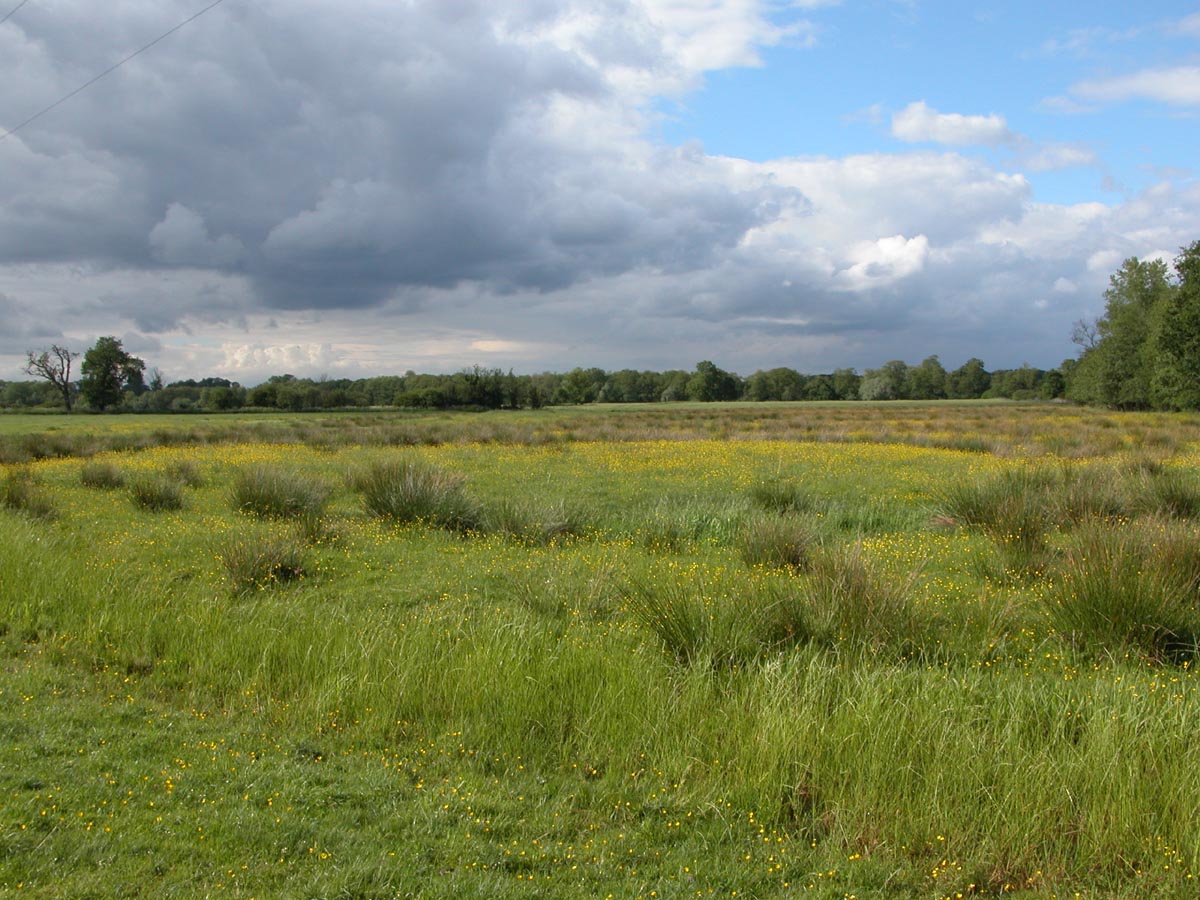
    First narrowboating on the Cam, the Ouse (and briefly the Lark) on Zinfandel (slight disclaimer: the owners are friends); the pic is of the maze at the foot of the West tower of Ely cathedral; the "ghost" is Miranda. Second, camping at the Dower House campsite with friends (M stayed at home for this); the pic is of a rough pasture on the way to the hard-to-find river.

    Comments


    Blogger comment software is cr*p. If you post a comment, I get an email. *But* it doesn't tell me on what post. So if you post to a recent one, thats fine, I'll find it. If you post to an old obscure one, I won't. So if you want an answer and you're posting on an old post, please include some hint as to the title or subject (obscure comments like "haven't you heard of photosynthesis" aren't much of a hint; OTOH its probably not worth responding to either).

    OTOH #2, you may prefer to just copy the post or your comment to sci.env: I read that, and then at least we can skip the tedious complaints of censorship.

    Traffic


    I'm a bit puzzled by the traffic stats. I post nothing for a week and end up with quite a few visits (they normally tail off if I don't post (which also somewhat puzzles me, cos how do people know I'm not posting if they don't visit...)) and... a practically doubled advertising income, now above the not-at-all-magic $7 mark. Saturday got me $2.86, wow.


    Memes


    Lastly, the title is of course Bowie, and is in response to Music Meme from TL (which was in turn...). And the answers are:


    1. Not much, just a bootleg of "The Drowned Lovers" copied from my video of Kate Rusby at the Folk Festival a few years ago as a test. Its about the only song of hers I really like.
    2. Changes.
    3. Not sure, it was some time ago. M got me "Open Season" by British Sea Power, which I've come to like, and of course includes the now-classic "Oh Larsen B" (amusingly, my post is now google hit #2 for that string).
    4. A bit tricky, since I don't have an iPod or an iStoat and I tend to leave the same album in for a week or more. Which for the last week has been Hunky Dory, and the previous week Scary Monsters, since I'm having a Bowie revival. So picking my favourites from these:

      • Its no game (part I; Japanese bits for JA...)
      • Teenage wildlife
      • Kingdom come
      • Quicksand
      • Bewlay brothers
      • Life on Mars?
      • Rambling Sailor (which comes in two rather different versions: a and b. B is the version I'm used to. And, err, yes, this isn't Bowie, its Spiers/Boden sort of, but that was on for a month a while back)

    5. I too will pass...

    2005-05-29

    Sea ice: What I do in my spare time :-)

    In the small amount of spare time I have in between blogging, editing wikipedia, posting to sci.env, bringing up two children and looking after the garden and occaisionally talking to my wife and... so on... I sometimes manage to find some time to do actual real work. And this post is about that.

    Also: I (and others) frequently decry the medias habit of only reporting sensationalised science; yet I think I probably spend most of this blog discussing such myself. Admittedly in an attempt to explain rather than sensationalise. But as a (possibly rather boring) antidote, here I shall discuss my most recent paper: Connolley, W. M. Sea ice concentrations in the Weddell Sea: A comparison of SSM/I, ULS, and GCM data. GEOPHYSICAL RESEARCH LETTERS 32 (7): art. no. L07501 APR 2 2005. The figures here are taken from the paper.

    So: the issue: we run coupled ocean-atmosphere GCMs, which produce (amongst many other things) a field of sea ice concentration and depth in both hemispheres, and we would like to know whether they are right or not. I only do the SH. A simplifying factor there is that we have so few observations of sea ice depth that there is rather little hope of verifying the model depths, so we can stick to ice concentration, which since 1979 has been observed by satellite (there are earlier obs by sat, since 1973, but pretty well everyone agrees that these can't be merged consistently into the later series). This is done by SSMR/SSMI, which is special sensor microwave radiometer or imager, and you can read more about it at wiki. Basically you observe the upwelling microwave radiation in a couple of frequency bands (microwaves are good because they mostly go through clouds and stuff), and their horizontal and vertical polarisation, and from various ratios you then have a quantity that can be related to sea ice concentration. This then gives you a daily field of sea ice concentration.

    But, there is more than one way to do this. There are various issues (weather filters, tie points, etc etc) but the man point is that there are two main algorithms, viz the Bootstrap and the NASA Team (there are lots of others too: change the tie points and you can have your own. But its chosing what to ratio to what that is more interesting). I won't tell you the technical differences for the very good reason that I can't remember them. There is (rather well hidden underneath) some politics in all this: and if you probe people carefully they tend to tell you that intercomparisons favour the Bootstrap, but since people had worked on Team that they weren't about to give it up. Certainly the intercomparison papers I read and ref'd in the paper favour Bootstrap, but, err, they were written by the Bootstrap authors. OTOH if the Team folks wrote similar intercomparisons I failed to find them.

    Anyway: the other thing about Team is that until fairly recently it was the only one I had access too, and that my model (HadCM3) produced sea ice that had higher ice concentrations than Team (it also produced ice in a pattern around Antarctica that was somewhat wrong, but for the purposes of this I'm going to ignore the pattern and talk only about the concentration). Then I got access to Bootstrap and discovered that Bootstrap concentrations were higher than Team (though still a bit less than HadCM3). Imagine my delight: we could abandon those efforts to make the model produce less ice and just change the obs. But... this is a bit unsatisfying. We need some obs to verify the obs. So bring on... ULS (upward looking sonar) which sit under the sea for a year or two, going "ping!" every now and again and (after being retrieved and a whole pile of clever data processing to remove wave heights etc) producing a signal for "is there any ice above me" every 5 mins or so. Which can be averaged, over a month, into an ice concentration at a point. And there were about 8 of them in the Weddell sea - see pic. So, spiffy, we can compare them to the Bootstrap and Team data.

    Incidentally, note that this is a thing that happens: I didn't set out to write a ppaer about different sea ice concentration datasets, it just became obvious that I needed to know about this to validate the model and (inconveniently) no one else had done it already.

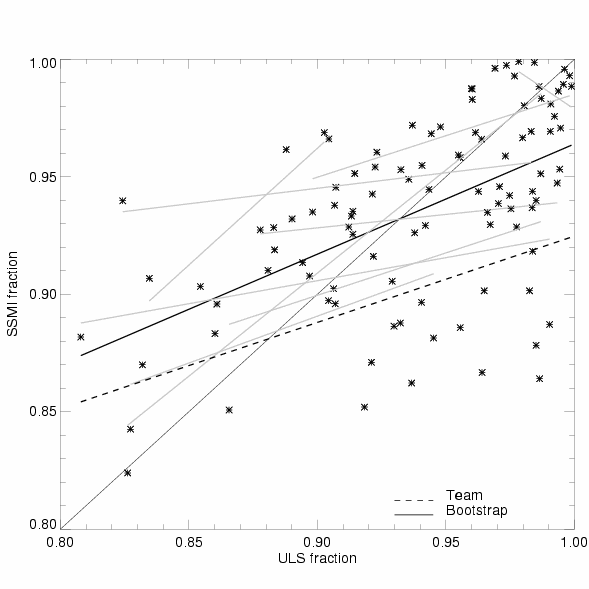
    And... we discover that the ULS doesn't fit brilliantly to Team *or* Bootstrap, but it does fit better to Bootstrap. The pic is a scatter plot, with ULS values on the x axis and SSMI (contemporaneous and colocated) on the y. The one-to-one line is where we want all the points to be. The thicker dashed line is a least-squares fit of all these points, using Bootstrap data. The thinner dashed is for Team (and to confuse you, the points are not plotted for Team, just the line). The grey (gray?) lines are what happens when you do the least-squares fitting at just the individual ULS's, instead of aggregating them.

    On the whole, I (and most people I spoke to) tend to assume that the ULSs are probably right, and therefore interpret the scatter on the plot as a measure of the SSMI retrieval being wrong. OTOH, there is a difficulty in meshing the ULS (point measurements with fine temporal resolution averaged up to monthly scale) to the SSMI (which has a 25 km^2 footprint, which I've averaged up to about 100 km^2, and is daily but I've averaged up to monthly). Quite how much scatter you expect from this, if the ULS and SSMI were both exactly "right", I don't know. But I haven't yet found a good reason why there should be a *bias* between them (ie, why the dashed line on the plot isn't 1-to-1). If you know a good reason, its safe to tell me: the paper is now published, and any new ideas can be fed into a new publication :-).

    So the end result of all this? The paper says that sea ice concentrations, at least in the Weddell sea, are probably higher than most people thought they were, and quite possibly even higher than Bootstrap says. And that consequently we can stop worrying much about HadCM3 concentrations. Sadly, it looks like HadGEM concentrations are rather lower... but you can't have everything.

    ps: I've decided I'm vaguely keen on explaining my work, so, if anything in the above is not explained, baffling, obviously wrong, whatever, do feel free to comment and I'll try to expand.

    2005-05-27

    Tackling Climate Change in Cambridgeshire

    Tackling Climate Change in Cambridgeshire is a report (pdf) for Cambridge County Council. Its interesting to see stuff coming down to our local level. But is it any good? Surprisingly, yes: at least on the words. They also have long lists of actions but I rather suspect that the cumulative total might be small.

    (BTW, I've abandoned the "more" stuff... it was too annoying).

    Point number 1, they get the science pretty well right (The average global surface temperature has increased by about 0.6°C in the last 100 years, and there is strong evidence that most of the warming over the last 50 years has been caused by man. This is mainly because of the release of greenhouse gases leading to an ‘enhanced’ greenhouse effect. The gases accumulate in the atmosphere and remain there for many years, driving climate change. Scientists think that if we do not limit the release of these gases, temperatures around the world could rise by between 2° and 6°C by 2100). Perhaps this isn't too surprising - septics have got nowhere in UK climate science or govt science policy making, or even in general policy making (see my prev analysis here). They are only present by default in that the UK govt action doesn't really measure up to the words.

    Point number 2, they tell you where Cambridgeshires CO2 comes from, via an analysis by CERC (who?). And the answer is, as of 2002: electricity 32%; waste 16%; transport 16%; manufacturing and construction 12%; residential 10%; industrial 6%; agriculture 5%; commercial/institutional 3%. This isn't quite as useful as it could be, because presumably the "electricity" term would be better split up amongst the various classes of users. In fact... is this data presented as you would want it? Shouldn't it be split amongst the user classes (residential/ind/ag/manuf/commerce) and then the three "creation" classes waste/elec/transp (with heating and lighting then needing to be extra classes). Anyway, we end up with 15 tonnes/person/year.

    So what about the action bit? They have decided to adopt the "ambitious" target of 20% less than 1997, by 2010, which is the same as the national targe, which... err... we're not going to make. They also promise to "work towards" a 60% reduction target. Hmm. The council is going to do things to its own energy usage. It buys a lot of its electricity (80%) from renewable suppliers. It designs in energy efficiency into new buildings. It runs some vehicles on LPG (which is says is both cheaper and produces 20% less CO2). It makes efforts to avoid its staff having to drive (though moving its HQ out to Cambourne didn't help me: I used to cycle when it was in Cambridge, now I must drive. To be fair, now I think of it, it was South cambs that moved, not the County, which is still inside Cambridge). And much more, if you read the report. But... there isn't a lot to say quite how this is going to get them to their county-wide 20%-less-by-2010 target. Which is only 5 years away.

    Theres also a section on "adaption", where again they get the science right, in that they notice that even present levels commit us to more climate change in the future.

    So... all in all quite good words, time will tell for the action.

    2005-05-26

    Recommending Rahmstorf

    Stefan Rahmstorf has an article about climate sceptics (trans from German) at http://www.pik-potsdam.de/~stefan/.... Theres lots of stuff there, nothing too novel to anyone who reads here or RealClimate, but its well presented.

    One thing it mentions as wrong is Jaworowski’s article in ESPR, which is taken to pieces by Some are Boojums (as well as Hans Oeschger on SaB). In fact I shall add SaB to my list.

    2005-05-24

    Confusion from Tim Worstall

    Tim Worstall (of ex sci.env fame) has been going down in the world, and now writes for TCS. His latest is Things Look Brighter on Planet Earth, a rather confused take on the global dimming/brightening which is rather better reported :-) at http://www.realclimate.org/index.php?p=154.

    The papers aren't really joint, just coincident. But more importantly, it isn't really about albedo either. If changes this big were due to albedo, ie the changes reflected top-of-atmosphere chnages in fluxes, they would be so enormous as to be readily detectable in the temperature record. They aren't. So they are, more, changes in the distribution of energy within the climate system. As it happens there is a paper in the same issue looking at albedo changes, but thats different.

    But the meta-issue above this, which TW attempts to use these for, is: uncertainty, and/or how much should we trust the IPCC reports. TW sez:

    As I say above, the first thing I take from this is that we do not, in fact, know everything about this subject yet. The IPCC report is, quite clearly, not the last word on the subject, for if it were, no one would be able to find something to publish on the subject, right?

    This is stupid, because its trivially true, and indeed acknowledged by anyone sensible: the IPCC TAR wasn't the last word, which is why thousands of people are currently working on the AR4. But what TW appears to be saying, or trying to imply without actually saying it because its a logical non-sequitur when said out loud is: "and so what is in the IPCC reports is wrong, and/or too uncertain to trust". But TW is so pleased with his vacuous comment that he repeats it at the end of the article.

    More not-betting; James' empty blog

    JA is doing more septic-teasing by discovering that when they say "no reasonable offers refused" what they really mean is "we refuse to put our money where our mouth is", this time Pat Michaels at WCR (WCR, the "blog" that is so frightened of you it doesn't allow comment on *any* of its posts...).

    Since I've added him to my blogroll, I won't be recommnending his posts again: I'll assume you can see them yourself.

    I've also slightly revised the blogroll tagline, to "other blogs", since I'm now quite fond of this one.

    JA's betting-on-climate is turning out to be quite entertaining. None of the septics are prepared to put up. I thought that maybe some would, just to shut him up. But then I suppose they would have to watch, year by year, as their bet unravlled, and that would be embarrasing. But the current situation is going to get embarassing for them too, soon. At the moment its below general public notice (George Monbiot against Myron Ebell was the most public its got) but that is likely to change.

    ps: more blogger "more" pain: I now discover that if I *don't* put in the span tags, then it still puts in a ...more... message, even if there is no more! Argh

    2005-05-23

    70's cooling again: but why?

    The good old "1970's cooling" stuff comes up again, this time over at Slate about an article by Chris Mooney. CM blogs about this with "Here We Go Again Over in the "Fray" at Slate, they're having a pointless argument over global "cooling" in response to my recent piece. Will the misinformation ever end?". But in fact, things aren't that bad at all...

    Because the comments end up with the right answer: which is to refer to the RealClimate post on the same subject. Excellent.

    But re-reading that, and my page http://www.wmconnolley.org.uk/sci/iceage/ I find that one thing is missing, or there only by implication, which is to answer "OK then, so why was there a cooling trend from the 40's to the 70's, if CO2 was increasing?". Which is a fair question. The right answer above answers it about right:

    Firstly, the cooling was fairly small, and if it wasn't in the middle of warming periods it probably wouldn't even have been called cooling. The cooling was stronger in the NH (which fits the aerosol explanation), and even there it isn't (in retrospect) nearly as large as some of the datasets of the time seem to have implied.

    Secondly, its quite explicable within the standard theory: as usual, its all in the IPCC TAR, specifically SPM and figure 4 and fig 12.7 . Which is to say, its mostly the sulphate aerosols. Those figures can be over interpreted though: as it says elsewhere " These results show that the forcings included are sufficient to explain the observed changes, but do not exclude the possibility that other forcings may also have contributed". Which is to say... that modelling will get better, we may well tighten up these results, and may even discover something unexpected: but its certainly wrong to say the cooling is inexplicable.

    Learning how to do more

    I've finally (I think) discovered how to do "...more..." with blogger. Its a bit of a pain, involving edits to the template and each post. To find out how...

    ...read on! So, its all explained at Blogger advanced help and its rather harder than wordpress (where you just put <!--more--!> or somesuch into the post.

    Hmmm... forgot to edit second template... try again...

    2005-05-21

    Looking at... David King on OpenDemocracy

    Over at OpenDemocracy.net they are running a special feature on debate on climate change. The "kick-off" pair of articles were by David King presenting the std.consensus view, and one by Benny Peiser who, lacking much to say, is obliged to puff up uncertainty. I ripped that up here. But what of David Kings contribution? Is that any good? Lets take a look...

    Oops, first a caveat: I'm a climate modeller. So I can do that bit. I'm not so good at "impacts" and I try to steer clear of it. I'm going to be obliged to mention them in what follows, because DK does, but remember to devalue my opinions in those bits.


    Headline: "Global warming: a clear and present danger". I'm a bit unhappy about that (see RealClimate post here) but I'll try to stick to the science (and its possible he didn't choose his headlines; but based on what follows, this is unlikely).

    Bit of history (this-isn't-new) then "...global temperature increases of 1.5-6C for a doubling of carbon-dioxide levels". This may be the wrong numbers (see here) or maybe not - I'm not certain.

    Mentions IPCC and Kyoto.

    Nonetheless, it is often reported that scientists themselves cannot agree whether climate change is really happening, whether it is influenced by human activities and whether, even if both things are true, it really matters that much. The bad news is that this is for the most part a pseudo-debate. Tempting as it may be for some to believe that “it’s just the environmentalists doom-saying again”, the reality is that the overwhelming majority of credible scientific opinion is clear on all three points. Well, you have my opinion of the consensus via the RC link above. I think it includes the first 2 points, and a third (cl ch will continue) but is weaker on the fourth, impacts.

    Beyond any reasonable doubt, climate change is happening. Fair enough.

    Unmitigated climate change will both magnify humanity’s existing scourges – poverty, disease, famine – and add to these new ones, such as through increasing climatic extreme events, rising sea levels and flooding on a scale beyond human experience. Yeeeeeeesss ish. Less happy here: as above. Sea level is the only one I'm reasonable sure about: the IPCC mid value is about 0.4 m to 2100.

    Part of the answer is in the nature of the media itself, which likes to present two sides of a story. “Scientists agree” is not such a great head line as “scientists at loggerheads”. Definitely agree.

    There is also an issue that some, including some politicians, simply do not want to hear the evidence, regarding the implications as just too unpalatable (and politically unpopular) to be faced. Again, agree.

    DK then goes on to examine groups of skeptics.

    1: those basically scientists, but doubting. Lindzen as example. OK, as far as L's science writing goes; not true for his "popular" works.

    2: small group of scientists who appear at every meeting but are not seriously regarded. Not familiar with this grouping.

    3. very vocal group of professional lobbyists. Yes.

    Summary: the balance of international scientific opinion is enormously in support of the conclusion that climate change is a real and present danger, requiring urgent and committed action. As above, I'd prefer a different description on the impacts side, but agree on the basic science side. [T]he arguments put forward by the sceptics gain publicity and influence far beyond that which can be justified by the standing of the individuals concerned, by the validity of their arguments, and by the scientific credibility of the evidence that they are able to put forward. To this I wholeheartedly agree.

    Someone asked in particular about a French scientist who claims from a study of records of tea plantation companies in Tanzania that there has been no temperature increase around Kilimanjaro despite the loss of 85% of its ice cap (which has been dated back to the last ice age) over the past 100 years. I'm not familiar with this. From what I've heard, Kilimanjaro isn't a great example of anything: Kaser et al. suggests that the retreat of K's glaciers isn't directly temperature related. Others (no ref; sorry) suggest otherwise. But... so what? DK is correct to say that we shouldn't pay much attention to anyone "disproving" GW by looking at K; K is just one place; and whatever the mechanism for the glacier retreat there - T related or not - it won't say much about GW. For that, you want to look at glaciers globally: Eric Steig at RealClimate did that recently.

    Estimates of future climate change

    Current estimates of future climate change are quite uncertain - the IPCC TAR headline figure was 1.4 to 5.8 oC. But that doesn't mean quite what most people think it means, because it includes uncertainties in CO2 emissions, which themselves are large. So if you're interested in the uncertainties just from uncertainties in the models, or the change at 2*CO2, then you need a different number. This is then the climate sensitivity (equilibrium at 2*CO2) or more usefully (and somewhat smaller) what the IPCC call the Transient Climate Response or TCR, which is the temperature change at CO2 doubling following a 1% CO2 trajectory. The number would varies a bit, but not much, if you followed a different plausible trajectory. It is 1.1 to 3.1 oC IPCC, here. This needs to be said with the standard caveats: that the global figure conceals regional variations, and that the model range may or may not encompass the true range.

    I mention this in particular because David King may have made this mistake over in his piece at Opendemocracy, saying: The most recent calculation, based on enormous computer programmes at a number of world centres, including the Hadley Centre for Climate Prediction and Research, yields global temperature increases of 1.5-6C for a doubling of carbon dioxide levels. So if by most recent he means IPCC, I think he has the wrong numbers. Unfortunately he doesn't source his statement, so he may well mean some more updated numbers.

    2005-05-20

    Global warming is not from waste heat (2)

    A little while ago, I proved conclusively :-) that the recent temperature increase isn't from waste heat. In essence, its obvious: the energy from waste heat is about 1/100th of the radiative forcing from GHG's.

    When I wrote that, I had forgotten about Nordell 2003 (subscription required, but you can see the abstracts, and the people commenting on it), which has recently resurfaced amongst the comments at RC.

    Thomas Palm succinctly summarises it thus:

    I've read the paper by Bo Nordell and it is junk. Here is as summary I wrote in sci.environment after having read it:

    The difference between the surface of the Earth and space is 33 degrees.
    Geothermal heat produces about 0.07 W/m^2 heat. And if this causes 33
    degrees heating the climate sensitivity must be 470 K/W/m^2. Thermal
    pollution is 0.02 W/m^2 and will thus give a heating of 0.02*470= 9 K.
    The mathematics he uses reduces this by a factor of 3, but essentially
    this is his argument
    .

    If Nordell *were* right, we'd be seeing huge fluctuations in global temperature as a result of the small variations in solar forcing.

    Only just recently, two letters have been sent to the journal Nordell published in (Global and Planetary Change) saying pretty much the same, but more politely, as befits a scientific journal: the first by Curt Coveya, Ken Caldeiraa, Martin Hoffertb, Michael MacCrackena, Stephen H. Schneiderc, Tom Wigley; and the second by J. Gumbel and H. Rodhe (the latter are pretty fierce by academic standards, saying This paper is seriously flawed and contradicts basic principles of physics. The paper contributes wrong and misleading arguments to the important discussion about human impact on the Earth’s climate).

    Both of these point out the obvious, as I did: that the thermal pollution term is tiny by comparison with the GHG term. They also point out that Nordells model is far too simplistic to be any use: As these basic assumptions by the author are in error, all subsequent conclusions are also in error. We would also like to comment on the atmospheric model used by the author to obtain his radiative results. This model is based on simplistic assumptions that make it inappropriate for any quantitative calculations (G+R again).

    The original Nordell paper, in its intro, makes a couple of characterisic septic-type mistakes: repeating the debunked wv-is-98% claim (OK, so *we* hadn't debunked it when Nordell published, but it was just as dodgy then); quoting Lindzen *1992* on models (how they got away with ref'ing that in an alleged scientific journal I don't know).

    Nordell then responds to the comments, but to my mind unconvincingly.

    Tear our pleasures with rough strife / through the iron gates of life

    If SC can quote Marvell, so can I. Mine is only a fragment:


    ...Now therefore, while the youthful hue
    Sits on thy skin like morning dew,
    And while thy willing soul transpires
    At every pore with instant fires,
    Now let us sport us while we may;
    And now, like am'rous birds of prey,
    Rather at once our time devour,
    Than languish in his slow-chapp'd power.
    Let us roll all our strength, and all
    Our sweetness, up into one ball;
    And tear our pleasures with rough strife
    Thorough the iron gates of life
    Thus, though we cannot make our sun
    Stand still, yet we will make him run.

    2005-05-17

    Beekeeping and changing agricultural practice

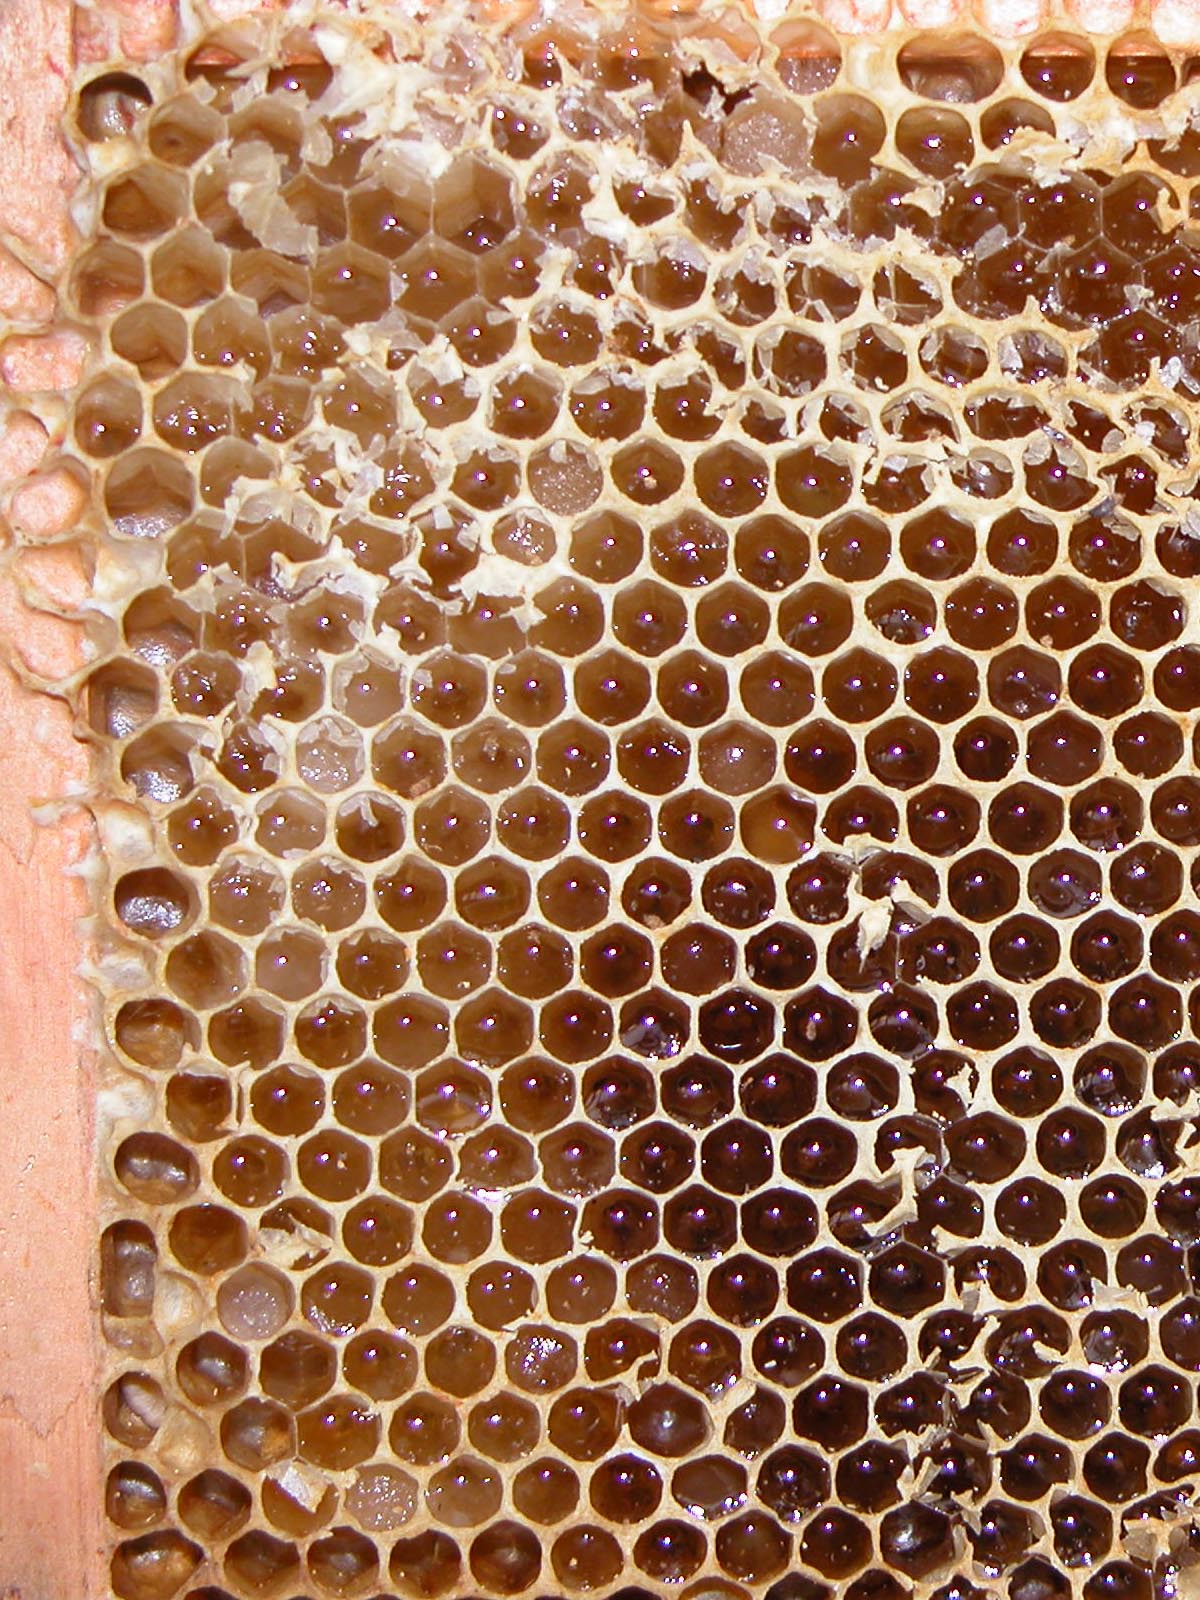
    I'm a beekeeper. You might have noticed. In the long-ago, about this time of year, people would be leaving their bees to get on with it. But in the UK nowadays rape plants are commonly grown for the rape seed oil, and in the spring time these produce vast acreages of bright yellow flowers (I think it looks quite pretty: many people hate it). They are also very good for nectar flow, and produce large amounts of honey. But. The honey very rapidly granulates. So much so that you can't leave the bees to cap it over, it has to be taken out (about now; and perhaps again a few weeks later), spun out and bottled. If you don't, it just granulates in the comb and its uselss to the bees, and then you have to melt the comb down, which is messy and painful.

    The photo shows a corner of a frame left in a bit too long (I should have done it on sunday, but we were in Oxford for M to take part in a piano competition (round 2). She came second (a close second we thought...)). Over on the right, the darker cells are liquid. Rightwards, paler brown are partly granulated; some white ones are solid. I spin it, most of the liquid comes out, put it back on a hive and hope the bees will turf some of the granulated stuff out. If you look closely, you can play spot the wax moth larva.

    Comments on Prometheus

    RP wrote:

    In the discussion motivated by Oreskes' Essay, I have seen one claim made that there are more than 11,000 articles on "climate change" in the ISI database and suggestions that about 10% somehow contradict the IPCC consensus position.

    This claim is so wacky I couldn't even place it. RP didn't seem to either. It turns out (see Peisers reply to my comment (side note: is it weird that Peiser is supplying the references for Pielkes articles?)) that this is ref'd to Timo Hämeranta, another std.septic, and it isn't even correct: even TH only claims to have 4,000 abstracts, and I would guess that his categorising ability is no higher than Peisers. What exactly is the point in giving prominence to stupid claims like this one, except to give them credibility?

    OTOH, RP *does* say:

    Like Oreskes, I am happy to take the IPCC as the best assessment of state of climate science, and its conclusions as an accurate measure of the central tendency of views among the climate science community. The work of the IPCC, including its certainties and uncertainties, is plenty good enough for the development and promulgation of a steady stream of policy options on climate

    which is confirmation of his non-skeptic status, should one ever doubt it (ahem).

    But RP then continues:

    But so what? If that number is 1% or 40%, it does not make any difference whatsoever from the standpoint of policy action.

    This is wrong. If 40% of papers doubted the consensus, there would be no consensus.

    2005-05-16

    Sudoku

    Since Christmas (when Jessica first showed me a fiendish one, which I failed to solve over several days) I've been keen/addicted to Sudoku number puzzles. Here is one, not too hard, in case you don't know what they are:


    +---+---+---+
    |7.2|...|.8.|
    |...|4..|..1|
    |.6.|.3.|9..|
    +---+---+---+
    |..4|...|.7.|
    |...|5.1|...|
    |.3.|...|2..|
    +---+---+---+
    |..1|.2.|.9.|
    |9..|..7|...|
    |.8.|...|3.5|
    +---+---+---+


    You then have to fill in the numbers 1-9 in each row, each column, and each 3x3 sub-square. Note the symmetry of the initial placement: this doesn't appear to be essential, and doesn't imply any symmetry in solving it.

    They first appeared in the UK in the Times, then the Torygraph, and I grew annoyed that the Grauniad (which we get) didn't have them, I was reduced to scrounging Times's from various places (notably CB1, where it is now traditional for Rob not to do them...). Then the Grauniad just a week ago succumbed, good, about time too, pity they had to ponce around with stuff about how theirs were human-generated hand hence much better (they are slightly different in style, but not clearly any better). Apparently they are even in the Sun, though presumably not the difficult versions :-).

    And... they originate in Japan, land of mystic east (cue tinkly glasshopper type music). Except... I asked JA at EGU if he had ever seen one (he works in Japan) and... no, he never had.

    I can do the fiendish ones now. Half an hour, on a good day.

    More flexible and agile funding...

    ...and I'm sure you all know what *that* means! I don't pay much attention to NERC finances, and indeed didn't understand all that much of todays presentation, but it looks like the much-vaunted uplift to the science budget that the govt announced a year or so back has all melted away, to no-ones great surprise.

    Meanwhile, we are still world leaders at renaming things, with SOC now called NOC, hurrah!

    Do I sound bitter and cynical?

    2005-05-10

    Talking to children

    Back in March, I posted about a general-cl-ch talk I gave at Cafe Scientifique. After that, a student at Hills Road Six Form College (err, for non-UK folk, thats pre-university) invited me to give the talk there, which I finally did today, to an audience of 18 people (16-years-old-ish, I guess, and 2 teachers) at the "physics club" lunch time talk series.

    This time, instead of a 10 minute talk that burst at the seams into a 15 minute talk, it was the same set of slides expanded to about 30-40 mins and 10 mins questions. And I was delighted with the questions, because they were far better, more interested, more aware than those from 70+ of the general public.

    And those questions were... some discussion of THC collapse, aka "Day after tomorrow". Its fairly clear people are still keen on it as a concept, no matter how much I try to downplay it. Q: "didn't it happen in the past, 13 kyr ago?" (internal answer: well done, right date, you don't get that often): A: yes, but linked to the Laurentide ice sheet, that mechanism can't happen now. Q: "but what about glaciers in the Urals etc? Is that in the GCM runs?" A: snow in the Urals may be in there but glaciers too small to represent in GCMs; but then the amount of water from those sources is probably too small.

    I explicitly mention impacts/politics at the end (largely to say: not my job guv; and trade-offs), so some Qs on that: "do economists try to value the environment?" to why my A: yes, papers in Nature etc, but its hard to do in a way that anyone will agree on (and there are at least 2 types of value: direct-econ-benefits that may not have been counted (e.g. water catchments), and pleasure-value (hiking in the hills)). Also Q: "but do your scenarios count the emissions from rapidly-industrialising India/China, and should/can we stop them?" A: yes the pessimistic ones do (I show the SRES range from the TAR SPM, I think); and how we end up with a vaguely equitable distribution of GHG emissions I don't know; tech transfer perhaps; obviously they are likely to want our material standard of wealth, but hopefully they don't want all the crap we've got: I don't want to give up decent dentistry or doctors, but they are welcome to the M11.

    Q: "what about uncertainty/surprises (I'd talked briefly about the W Ant ice sheet collapse as an unquantifiable possible effect): shouldn't they be factored into the political calcs?". A: yes, but its tricky to see how to do that. A sane system would: in our insane system the major GHG emitter won't even accept the clear and obvious science, let alone the unknown bit (its all right, I didn't say "insane").

    Global dimming got asked about (a hang-over from Horizon): see RC for that, which I parrotted. "Committed change" too: yes, about 0.6 oC according to the most recent Hansen et al. (See RC again).

    So, a good session overall. My "public outreach" for the day, or PUS as we call it here (Public Understanding of Science).

    2005-05-09

    Thermohaline collapses. Or not. Again.

    People often pick up on the risk of future cooling over Northern Europe as a "paradoxical" consequence of global warming: most recently in the Times: Britain faces big chill as ocean current slows. I think that people get too enthusiastic about this, because of the exciting "paradoxical" features. One way to tell whether such reports are dodgy or not is by seeing if they reference "The Day After Tomorrow" without pointing out that the film was... just std.hollywoodjunk.

    A little disclaimer here: all of this is outside my immeadiate professional expertise, so for these purposes I'm just an interested amateur.

    My own view on this (and it was number 7 before) is that its all oversold; that a THC collapse is unlikely (based on the GCMs, of course: ...the probability of a THC shutdown is not high: in fact, it doesn't happen "by itself" in coupled models runs, you have to force it to happen; what you get is instead a slight slowdown and although there is a cooling tendency from the slowdown, the overall effect is warming, even over northern europe. The TAR, section 9.3.4.3 Thermohaline circulation changes is good, as always... was what I said before); and even that the role of the gulf stream is over emphasised.

    To take that last point on, try Is the Gulf Stream responsible for Europe’s mild winters? by Seager et al. in QJRMS (google "Seager gulf" if you want the pdf, and other interesting links). They say:

    Is the transport of heat northward by the Gulf Stream and North Atlantic Drift, and its subsequent release into the midlatitude westerlies, the reason why Europe’s winters are so much milder than those of eastern North America and other places at the same latitude? Here, it is shown that the principal cause of this temperature difference is advection by the mean winds. South-westerlies bring warm maritime air into Europe and northwesterlies bring frigid continental air into north-eastern North America. Further, analysis of the ocean surface heat budget shows that the majority of the heat released during winter from the ocean to the atmosphere is accounted for by the seasonal release of heat previously absorbed and not by ocean heat-flux convergence. Therefore, the existence of the winter temperature contrast between western Europe and eastern North America does not require a dynamical ocean. Two experiments with an atmospheric general-circulation model coupled to an ocean mixed layer conŽfirm this conclusion. The difference in winter temperatures across the North Atlantic, and the difference between western Europe and western North America, is essentially the same in these models whether or not the movement of heat by the ocean is accounted for. In an additional experiment with no mountains, the flow across the ocean is more zonal, western Europe is cooled, the trough east of the Rockies is weakened and the cold of north-eastern North America is ameliorated. In all experiments the west coast of Europe is warmer than the west coast of North America at the same latitude whether or not ocean heat transport is accounted for. In summary the deviations from zonal symmetry of winter temperatures in the northern hemisphere are fundamentally caused by the atmospheric circulation interacting with the oceanic mixed layer.

    Now, this isn't the end of the story, because "minor" effects like a 5 oC change can still come from changes in the ocean circ, and Robert Kunzig tells us:

    Other scientists are surprisingly willing to concede much of Seager's challenge to the Gulf Stream myth. Michael Vellinga of the British Meteorology Office's Hadley Centre agrees that the currents do not warm Europe preferentially. But he and others emphasize that they do warm both sides of the Atlantic in winter, by roughly 5 degrees. Although Seager calls that a "modest" effect, it's more than the difference between today's climate and that of the Little Ice Age, from the 16th century to the 19th century, when both Europe and the United States endured many a rude winter. "If you switch [the currents] off, you get massive cooling," says Stefan Rahmstorf of the Potsdam Institute for Climate Impact Research in Germany.

    But shutting down the THC wouldn't shutdown the Gulf stream anyway, since its a Western Boundary Current driven by the winds in one of those odd mysteries of ocean dynamics.

    2005-05-08

    Weasel words from Peisner

    What a lot there is to write about at the moment...

    So, the excitement is over at Deltoid: here, where the discussion of Peisners abstracts continues, with P trying to defend himself. His latest line is:

    Even if there is disagreement about any of these papers, it is highly improbable that all 34 are ambiguous.

    Which is appalling, though I think it now explains why he has so many dubious abstracts in there: he is trying to say, OK, so I was wrong about most of them, but is it likely that I was wrong about *all* of them? Ie, scattershotting as many as possible in the hope that something might stick.

    He has also found the "missing" abstract, of which he sayeth:

    The attached abstract includes a statement stressing that the "development of alternative, environmentally safer energy production technologies will benefit society whether or not global climate change actually occurs." I interpret this statement as a weak form of scepticism about what Oreskes defines as "consensus position".

    Err... which is nonsense: see Deltoid for the full abstract. Peisner has thrown in the towel on Deltoid, without even trying to defend his choice of abstracts: very poor work. It was also pointed out to him over there why he got the wrong number of abstracts: he has failed to answer that, or to retract his now obviously false claim that Oreskes was wrong about the number.

    Detecting anthro change

    A little while ago (before Cmas?) there was excitement about a Barnett study, reported at a conference, showing detection of an anthro signal in the worlds oceans. A Barnett study is available (here; thanks HET) but since this is from 2001 its presumably an earlier one. Anyway, to quote:

    Application of optimal detection methodology shows that the model-produced signals are indistinguishable from the observations at the 0.05 confidence level. Further, the chances of either the anthropogenic or observed signals being produced by the PCM as a result of natural, internal forcing alone are less than 5%. This suggests that the observed ocean heat-content changes are consistent with those expected from anthropogenic forcing, which broadens the basis for claims that an anthropogenic signal has been detected in the global climate system.

    A more recent paper (again in Science, this time lead by Hansen (see his comments about political interference with his press releases here)) is commented on by RC (by Gavin, since he is a co-author).

    The Hansen paper gets tagged with the tedious "smoking gun" idea again, which I have come to believe is just not sensible. John Fleck touches on the point here, and says most of what I mean, but not quite in the same words. What I think is now clear is that the evidence, objectively considered, for anthro climate change is now somewhere between incontrovertible and very strong. But, in certain quarters, this doesn't matter, because its not objectively considered. For these people, who very strongly *don't* want to be convinced, there may well never be a "smoking gun" - because the "gun" is always a complex matter of observations and modelling that needs patience to understand: and if you don't have or want this patience, there will always be a septic out there with simple, easy-to-understand (but wrong) arguments for why there is no problem. There are, after all, still people who can't accept things like relativity - and there isn't even any politics/money tied up in that.

    2005-05-05

    More betting on climate. Or not, as the case may be.

    Read Betting on Climate with Richard Lindzen by James Annan over at sci.env, containing the interesting Richard Lindzen's words say that there is about a 50% chance of cooling. His wallet thinks it is a 2% shot. Which do you believe? James really ought to get his own blog. Or at least post to the one he has sometimes :-)

    Peisners 34 (33) abstracts

    Peisners consensus-busting abstracts are now on display at Deltoid and... no, they aren't convincing. Some of them are so obviously not that including them is surreal.

    He seems to have included things just because of the word "uncertainty"; or "testing models", or... well, I don't know. Lets look at one of them:

    24. Regional climate change: Trend analysis of temperature and precipitation series at selected Canadian sites Clark JS, Yiridoe EK, Burns ND, Astatkie T Canadian Journal of Agricultural Economics-Revue Canadienne d Agroeconomie 48 (1): 27-38 Mar 2000
    Abstract: Global climate change does not necessarily imply that temperature or precipitation is increasing at specific locations. The hypothesis of increasing temperature and precipitation trends associated with global climate change is tested using actual annual temperature and precipitation data for nine selected weather stations, spatially distributed across Canada. Vogelsang’s (1998) partial sum and Woodward et al’s (1997) bootstrap methods are used for testing for trend Both methods suggest no warming in the Canadian temperature series except for Toronto, Ontario, which had significant increase over time, along with Moncton, New Brunswick and Indian Head, Saskatchewan, which had marginal increases. There is no evidence of increasing trend in precipitation except for Moncton, New Brunswick, which had a significantly increasing trend, thus, public policies designed to address the regional effects of climate change need to be adapted for a particular ecological zone, based on knowledge of the climate trends for that region, rather than on general global climate change patterns.

    Why is this in there as rejecting or doubting the consensus? There are many others of the same ilk.

    2005-05-03

    Consensus, again

    I'm going to do an EGU wrap-up post when I have a moment; in the mean time the Oreskes study is back in the news, since Peisner is challenging it. Both Tim Lambert and Chris Mooney have the details and links (actually TL's post is mostly about the Bray survey, but also includes some P stuff). TL is currently winning the whose-blog-should-we-post-comments-on war :-)

    My contribution is (a) to say that the easiest way to settle this is to check the 34 abstracts that Peisner says contradict the consensus, and (b) my bet is that when (if) he reveals this list, most people will agree that he has miscategorised most/all of them. I suppose I could add (c) all the evidence from EGU is that Oreskes was right.