The recent
Fred Singer Op-Ed in the WSJ has
drawn ire from just about everyone, because it was stupid. I'm guessing the WSJ didn't realise how dumb it was when they published it; they may have thought good ol' Fred was a reliable pair of hands, though why they'd think that I don't know.
[My apologies for the absence of the picture. The link, you'll see, is to https://michaelmann.net/sites/default/files/Screen%20Shot%202018-05-21%20at%205.09.56%20PM.png which existed when I wrote the post, but has subsequently been removed. I hate it when people do that.]
Aanyway, I wanted to discuss this pic, which seems to be popular for refuting the Fredster.
Mann uses it (somewhat carelessly without attribution; and, now I look closer, merely as a visual: nothing in the text refers to it);
ATTP is more careful, and sources it to
Hansen et al. 2016. But while ATTP is careful with his sourcing, he is somewhat careless with his phrasing, since the figure apparently
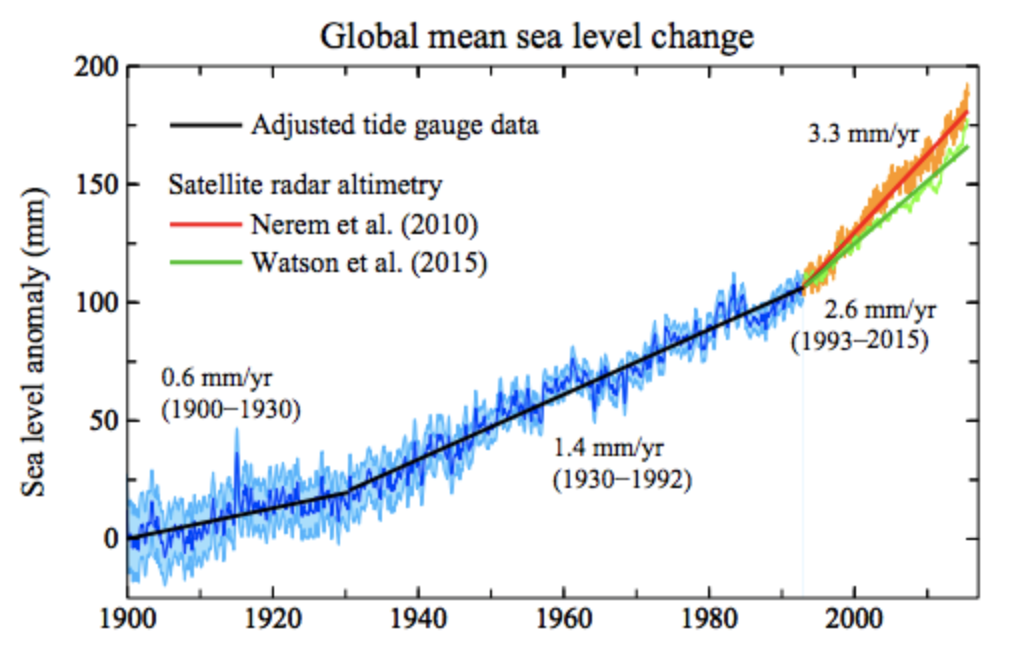
shows sea level rise is indeed accelerating. SL is definitely rising; it may be accelerating, but does the figure show that? It shows a long-term trend from tide gauges to 1993, and then a different - well, two different - rates from 1993, from satellite altimetry.
Having two different rates is the first and obvious problem. One of them is wrong, since they appear different enough to be incompatible. As science-in-progress that's fine; SL is rising whether it's rising at 3.3 or 2.6 mm/yr; but putting such a picture up as proof to the general public that you know what you're doing is odd (labelling another, whose data clearly extend past 2010, as "Nerrem et al. (2010)" is also going to confuse thinking people who don't understand the habit of extending datasets according-to-the-method-of, which I assume is what happened in this case).
Oh, lordy, and now I look the Hansen paper the figure comes from is
that Hansen paper. But that does allow me to find the caption: "Figure 29. Estimated sea level change (mm) since 1900. Data through 1992 are the tide-gauge record of Church and White (2011) with the change rate multiplied by 0.78, so as to yield a mean 1901–1990 change rate of 1.2 mm year−1 (Hay et al., 2015). The two estimates for the satellite era (1993–2015) are from Nerem et al. (2010, updated at http://sealevel.colorado.edu) and Watson et al. (2015)." The scaling by 0.78 stands out as an interesting point, which Hansen et al. justify with "Hay et al. (2015) reanalyzed tide-gauge data for 1901–1990 including isostatic adjustment at each station, finding global sea level rise to be 1.2 ± 0.2 mm year−1. Prior tide-gauge analyses of 1.6–1.9 mm year−1 were inconsistent with estimates for each process, which did not add up to such a large value (Church et al., 2013)". I'm not going to complain about that, just point out that This Stuff Is Not Simple.
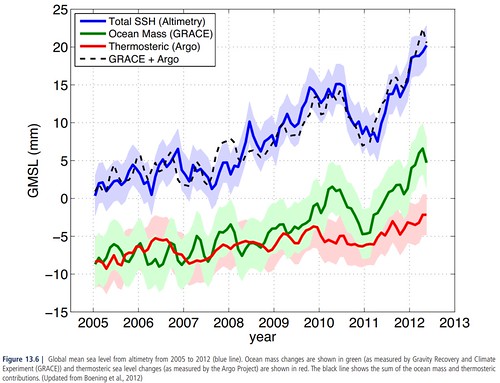
Kinda nice is this pic from AR5, which shows that changes in ocean mass (from GRACE) i.e. the land-ice-loss and stuff, plus changes due to temperature, about add up to what we see. From eye, the blue altimetry line is 20 mm in 7 years is 2.6 mm/yr, i.e. the green line in the previous pic.
The other obvious point is that the "acceleration" - actually, as presented, change from one linear trend to another - occurs when you switch the dataset from tide gauges to altimetry. It doesn't take much wit to ask: "I wonder if the change is real, or caused by the change of measurement method?" FWIW, if you were going to wonder which was more accurate, I'd go for the altimetry (the case is
not analogous to temperature measurement): tide gauges are not global (they tend to be on the edges of landmasses, oddly enough) and require many complex corrections for isostatic rebound; though satellite altimetry isn't absolute either.
Refs
* ATTP links this in the comments, but here (as proof of it's high profile :-) is
Gavin's tweet showing that
Climate-change–driven accelerated sea-level rise detected in the altimeter era by R. S. Nerem et al., 2018, is yer Top Source for "SLR is accelerating".
*
Sea Level Data: Church & White, or Jevrejeva et al.? - Tamino.
 Who? The other Mc as in McI. And what he says is I am not a scientific advisor to the Cornwall Alliance nor am I on the board of the John Deutsch Inst. I did not 'produce' any videos for Friends of Science, they interviewed me a few years ago at an event and have used the videos for their purposes. The previous edition of this page wrongly attributed FoS views to me. The bio information is obsolete. And who knows, he may be telling the truth.


 Hot on the heels of


 This would naturally be a comment over at CIP's blog, but